Objective
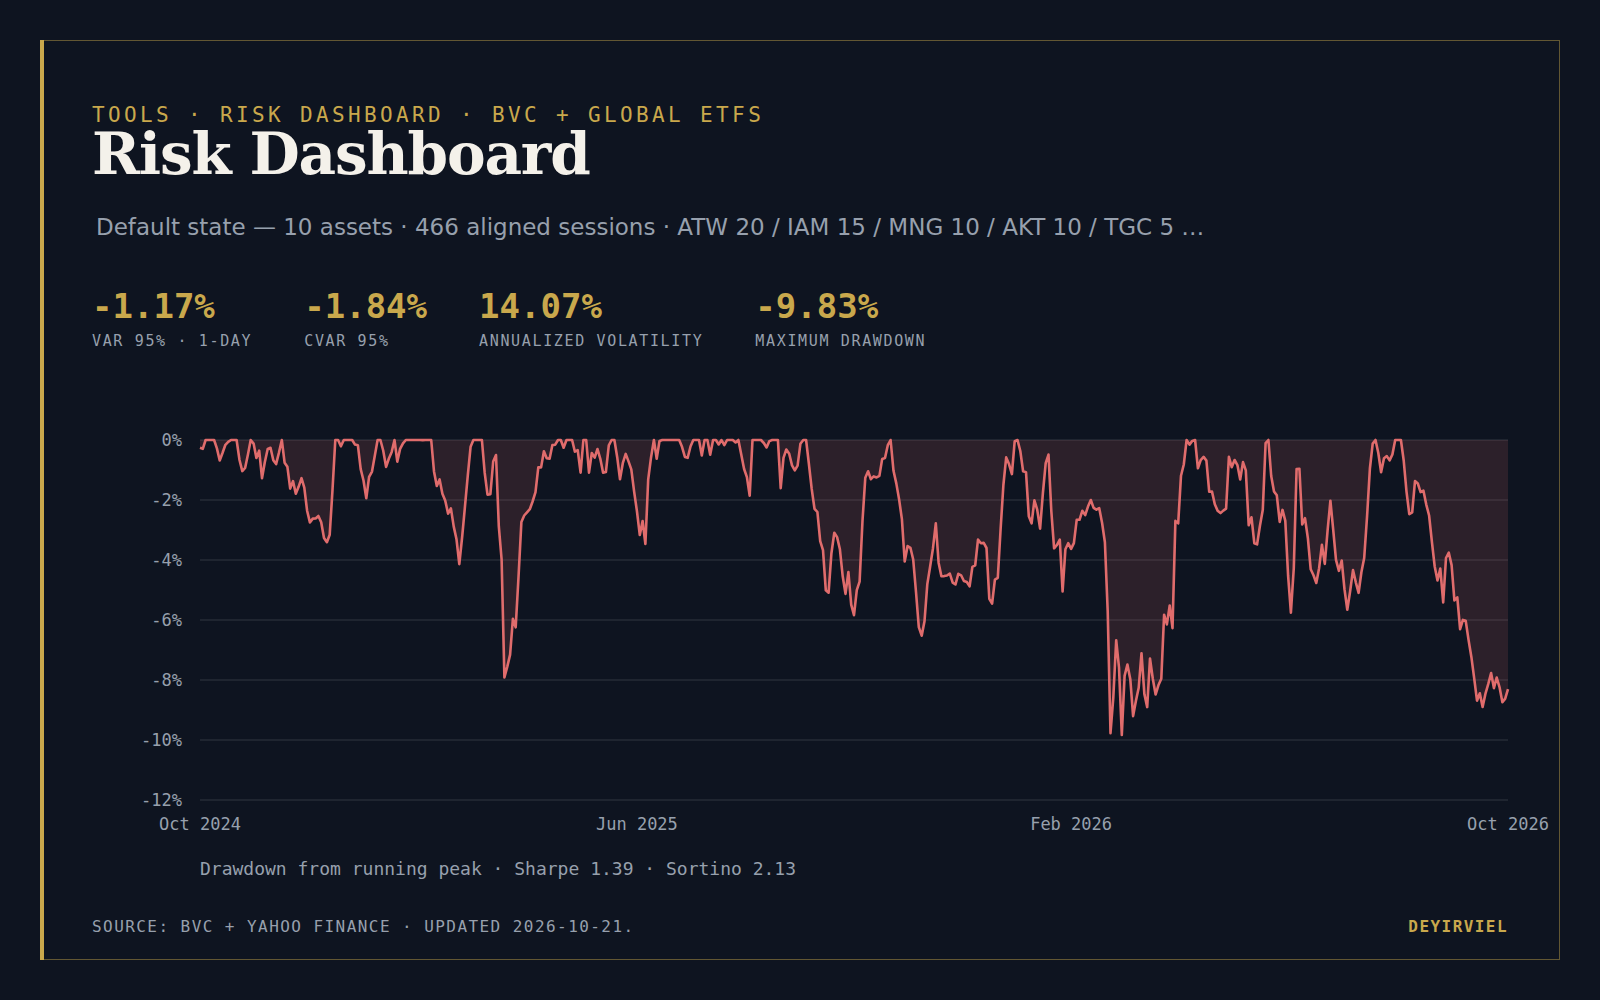
Measure a weighted portfolio rather than a single asset: how much can be lost on a bad day, how the risk has moved through time, and what a small set of deterministic shocks would do to the book.
Data and sources
Six BVC large caps and four US-listed ETFs, using aligned daily adjusted closes. The return history is precomputed by scripts/tools/build_risk_dashboard.py and stored in /data/tools/risk-dashboard.json; the browser recomputes every metric from that same payload when the weights change.
Risk Dashboard · BVC large caps + global ETFs
Measure the risk of a weighted portfolio
Historical risk
- VaR 95% (1-day)
- —
- VaR 99% (1-day)
- —
- CVaR 95%
- —
- CVaR 99%
- —
- Annualized volatility
- —
- Maximum drawdown
- —
- Sharpe
- —
- Sortino
- —
VaR and CVaR are daily return thresholds; negative values are losses.
Stress scenarios
| Scenario | Factor shock | Portfolio return | P&L on 100 |
|---|
Equity and rate betas are full-sample OLS estimates; the rate shock assumes a 16-year TLT duration.
Correlation matrix
Chart loads when visible
Chart loads when visible
Chart loads when visible
Charts unavailable. The tables and metrics above remain valid.
Methodology
Data and alignment
Daily adjusted closes for six BVC large caps and four US-listed ETFs. The BVC series come from the official Bourse de Casablanca publicstock-historical API; the ETFs come from Yahoo Finance’s adjusted-close history. Dates are intersected across all ten assets, so every daily return is observed on the same date. BVC returns are in MAD and ETF returns in USD; no FX conversion is applied.
Historical risk
Portfolio daily return isr_p,t = sum_i w_i r_i,t, with weights normalized to one. VaR 95%/99% is the 5th/1st percentile of the historical daily return; CVaR is the mean return at or below that percentile. Both are reported as returns (negative = loss). Annualized volatility is sd(r_p) * sqrt(252). Maximum drawdown is the largest peak-to-trough decline of the compounded unit-value path.
Sharpe and Sortino
The risk-free rate is an annual input, converted to a daily rate byrf/252. Sharpe is (annualized mean return - rf) / annualized volatility. Sortino uses the same numerator and a downside deviation sqrt(mean(min(r_p - rf/252, 0)^2)) * sqrt(252).
Rolling statistics
Rolling volatility is the annualized standard deviation over the selected window; rolling correlations are the Pearson correlations of the portfolio with SPY and with TLT over the same window. The full-sample correlation matrix uses all aligned daily returns.Stress scenarios
Each asset is regressed on SPY and TLT returns. The equity scenario applies a -10% SPY return and maps every asset through its SPY beta. The rates scenario assumes TLT duration of 16 years, so +200 bp is a -32% TLT return, and maps every asset through its TLT beta. These are linear historical-beta scenarios, not full repricing or causal models.Assumptions and limitations
- Historical VaR/CVaR are in-sample sample quantiles, not forecasts; tails are poorly estimated with roughly two years of daily data.
- The default weights are illustrative. Choosing weights after observing the sample would introduce look-ahead bias; the dashboard does not claim out-of-sample performance.
- Daily returns are treated as independent for annualization and scaling; volatility clustering and autocorrelation are not modelled in the headline metrics.
- Weights are normalized to 100%; the dashboard ignores transaction costs, taxes, liquidity and FX.
- BVC adjusted closes and ETF adjusted closes are used; corporate-action and dividend conventions differ by source.
- Stress betas are full-sample OLS estimates and can be unstable; the TLT duration assumption is an input, not a fitted parameter.
- Estimation error is not propagated into the headline risk numbers; confidence intervals for VaR/CVaR are not shown.
Reference computation
The default weights, 2.25% risk-free rate and 63-day window are also computed by the Python builder on the same aligned returns. The test suite compares the browser engine with that Python reference.
Sources
Methodology and assumptions
- VaR 95% is the fifth percentile of the historical daily return distribution; CVaR 95% is the mean of the returns at or below that percentile. Both are historical simulation, not a parametric or forecast model.
- Volatility is the annualized standard deviation of daily returns. Sharpe and Sortino use the configured risk-free rate; Sortino replaces total volatility with downside deviation.
- Maximum drawdown is measured on the cumulative return path. Rolling risk uses a fixed window so the series can be compared through time; rolling correlations are shown against SPY and TLT.
- Weights are normalized to 100%. Correlations and stress P&L are computed from the same aligned return matrix.
Limitations
- The sample is short relative to a full market cycle, and historical VaR does not predict the next crisis. It is an in-sample quantile, not an out-of-sample forecast.
- The default weights are illustrative. Choosing weights after observing the sample would introduce look-ahead bias; the dashboard does not claim out-of-sample performance.
- Estimation error is not propagated into the headline risk numbers. Confidence intervals for VaR and CVaR are not shown.
- BVC daily closes do not capture intraday liquidity, bid-ask spreads, block trades or transaction costs; a position that looks diversifying on daily data may not be executable at size.
- The stress scenarios are deterministic shocks chosen for illustration, not probabilities. They do not model correlation breaks or second-round effects.
- The tool is educational and analytical. It is not a risk-management system, not investment advice, and not a substitute for a limit framework.
Reproducibility
The input payload is versioned at /data/tools/risk-dashboard.json; the engine lives in assets/js/tools/risk.js and is covered by tests/tools/risk-dashboard.test.mjs. Any weight change is recomputed in the browser from the same return history.