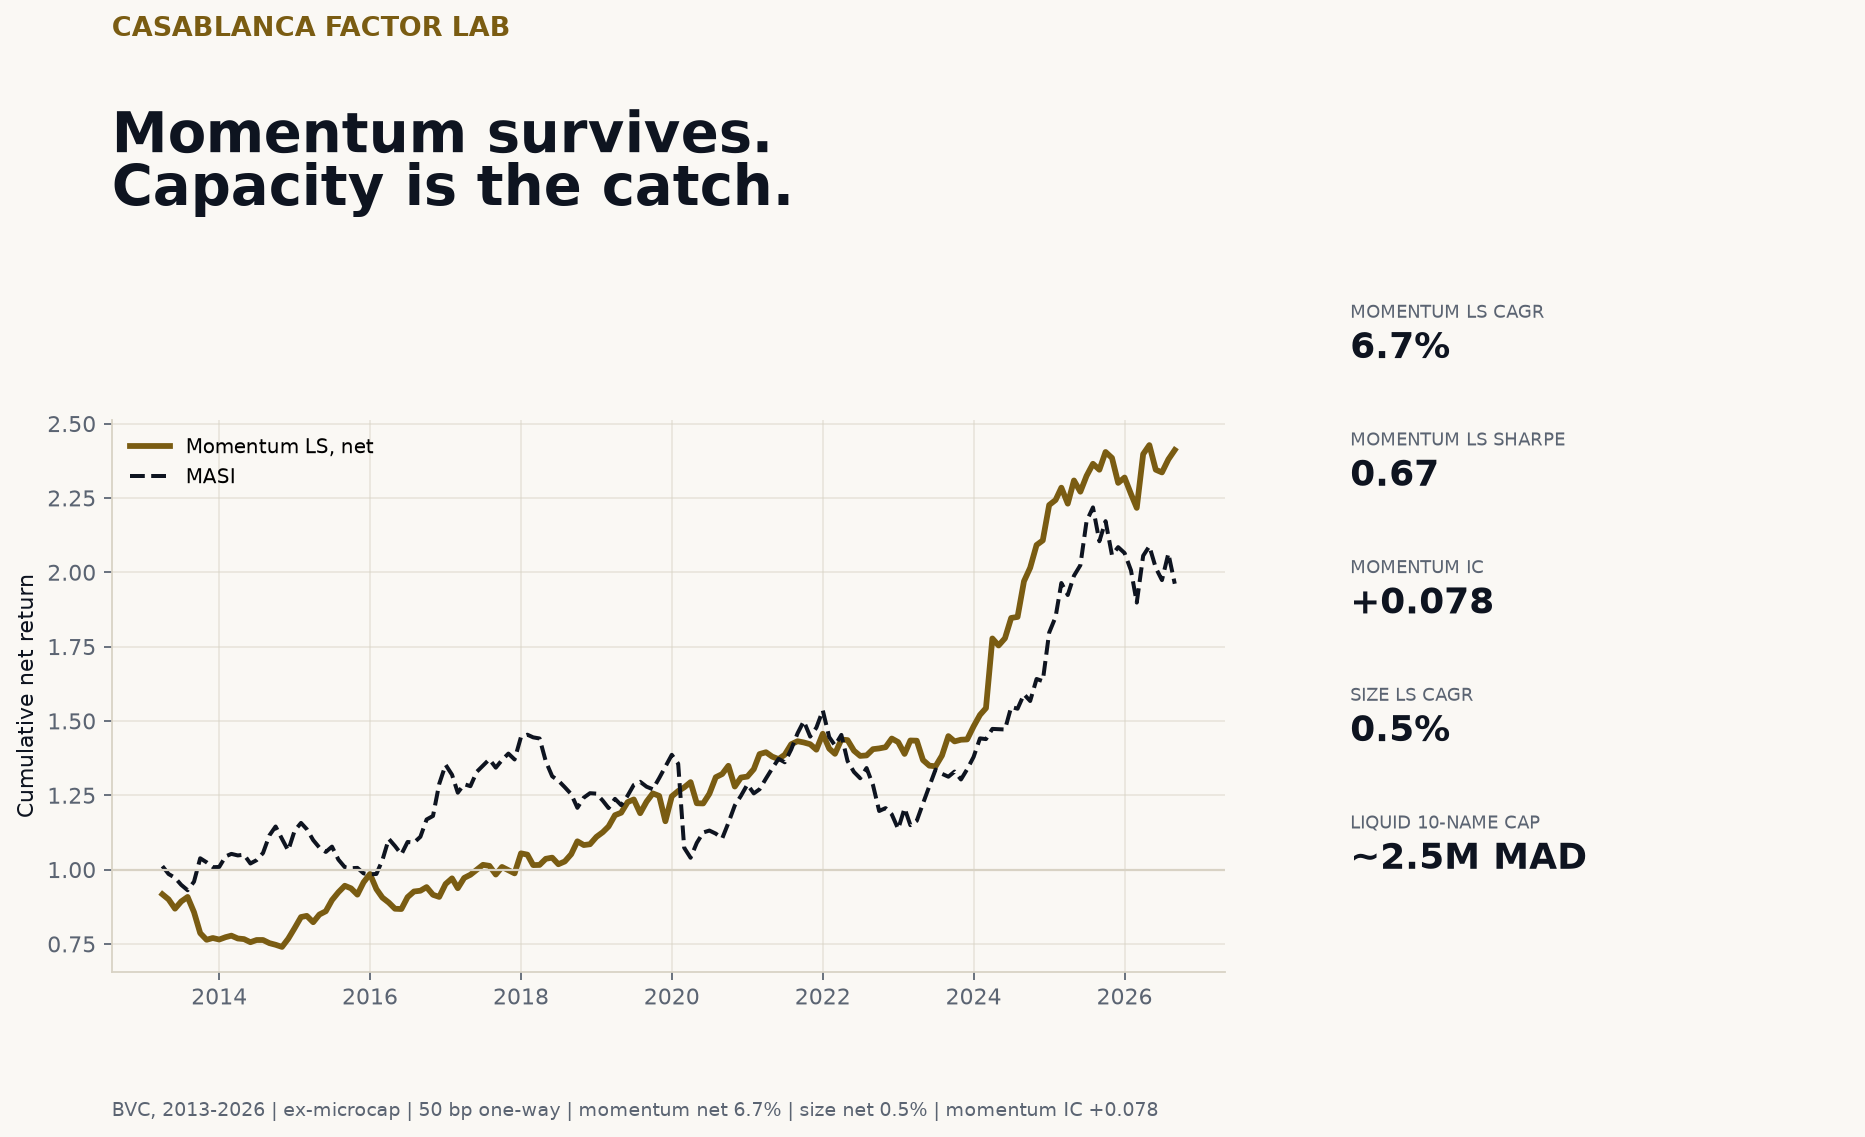
In one paragraph. Casablanca is a small, illiquid, concentrated equity market — a good place to ask whether factor premia are real or just market structure. I built a monthly panel of 76 BVC names from 2012 to 2026, pre-specified six price-based factors, and ran long-short and long-only portfolios with transaction costs, Newey-West regressions and ADV-based capacity. Only momentum survives: 6.74% net CAGR, 10.49% volatility, 0.67 Sharpe, 0.078 IC, 6.82% alpha (t = 2.50). Size earns 0.46% after microcaps are excluded, the value proxy -5.82%, low-vol -5.90%, quality 0.51%, liquidity -1.00%. The catch is capacity: a 10-name long-only momentum book hits 10% of ADV at about 2.5M MAD; the long-short version at about 3.3M. At 150 bp costs the momentum premium is 0.43%. Momentum works in Casablanca — until you try to trade it.
Résumé (français). Casablanca est un marché petit, peu liquide et concentré. J’ai construit un panel mensuel de 76 valeurs de la BVC de 2012 à 2026, pré-spécifié six facteurs de prix, et testé des portefeuilles long-short et long-only avec coûts de transaction, régressions Newey-West et capacité fondée sur l’ADV. Un seul facteur survit : le momentum, avec 6,74 % de CAGR net, 10,49 % de volatilité, un Sharpe de 0,67, un IC de 0,078 et un alpha de 6,82 % (t = 2,50). Le size rapporte 0,46 % hors microcaps, le proxy value -5,82 %, le low-vol -5,90 %, la qualité 0,51 %, la liquidité -1,00 %. Le piège est la capacité : un portefeuille long-only de 10 lignes atteint 10 % de l’ADV vers 2,5 M MAD ; la version long-short vers 3,3 M. À 150 pb de coûts, la prime de momentum tombe à 0,43 %. Le momentum marche à Casablanca — tant qu’on n’essaie pas de le trader.
What the data will and will not support
The BVC is a small market, and its data is small too. The cache has 76 price histories from 26 March 2012 to 14 October 2026. The current screen has 74 names; two cached names (DRI, EQD) are no longer in it. The monthly analysis stops at September 2026 to avoid a partial month.
The universe is thin at the start and wider at the end: the base universe has a median of 57 names, the ex-microcap universe 39, and the liquid universe 14. Names list over time — AKT in 2022, ARD in 2020, CAP in 2025, T2S in 2026 — and enter only after listing. There is no backfill.
| Data item | What it is |
|---|---|
| Cached BVC names | 76 |
| Current screen | 74 |
| Cached but not current | DRI, EQD |
| Daily coverage | 26 Mar 2012 → 14 Oct 2026 |
| Monthly panel | Mar 2012 → Sep 2026 |
| Median base / ex-microcap / liquid universe | 57 / 39 / 14 |
| Median current ADV | 0.92M MAD |
| Names with ADV ≥ 2M MAD | 28 |
| Median zero-return share (126d) | 14.3% |
| 90th percentile zero-return share | 26.2% |
| Median / p90 staleness at month-end | 0 / 3 calendar days |
| Daily moves beyond ±35% | 1 (CMT, 2026-09-16, −44.0%) |
The fundamental data is the binding constraint. There is a current screen with P/E, P/B, ROE, debt/equity, dividend yield, revenue, gross profit, net income and total assets — but no point-in-time panel of book value, earnings, EBITDA, debt, shares or dividends covering the backtest.
| Current field | Non-null | Median |
|---|---|---|
| P/E (TTM) | 60 / 74 | 18.27x |
| P/B | 62 / 74 | 2.63x |
| ROE | 65 / 74 | 15.42% |
| Debt/equity | 68 / 74 | 0.69x |
| Dividend yield | 56 / 74 | 3.56% |
A local scratch folder has annual reports for eight names (AFI, CRS, IBC, INV, MDP, REB, SRM, ZDJ), with incomplete years and no machine-readable panel. Eight names out of 74 is not a factor universe, so it is not used.
I therefore did not fabricate a value or quality history. The two fundamental sleeves in the table are explicitly price-based proxies:
- Value proxy: negative 36-1 month return (long-term reversal).
- Quality proxy: 36-month mean monthly return divided by its standard deviation (return consistency).
They are not book-to-price, earnings yield, EBITDA/EV, ROE, gross profitability or leverage. A negative result for the reversal proxy is not evidence that fundamental value investing fails in Casablanca. It is evidence that the price-based reversal proxy fails.
Three more biases are part of the result:
- Survivorship. The cache is built from a current screen. Names that delisted before the cache was built are missing; the 74 current names are survivors. Factor returns are biased upward, especially for small and illiquid names.
- Price-only data. Prices are closes, not total returns. Dividends and splits are not adjusted. Historical market cap is price-implied: today’s share count is applied to historical closes. The size factor is a price-implied size proxy.
- Stale prices. The BVC trades infrequently. The median zero-return share is 14.3%, the 90th percentile 26.2%. A 21-day staleness filter removes the worst cases, but monthly marks can still be stale. One print beyond ±35% (CMT, 2026-09-16, −44.0%) is treated as a bad print or corporate action and excluded from trailing volatility/liquidity; monthly prices are not adjusted.
Six factors, pre-specified
All six were specified before the backtest and all six are reported. No factor was dropped because it failed.
| Factor | Definition | Higher score means | Data |
|---|---|---|---|
| Momentum | 12-1 month return, skip the most recent month | Stronger momentum | Price |
| Value proxy | Negative 36-1 month return | More beaten-down | Price |
| Quality proxy | 36-month mean / standard deviation of monthly returns | More consistent returns | Price |
| Size | Negative log price-implied market cap | Smaller | Price + current shares |
| Low volatility | Negative 126-day realised volatility | Lower risk | Price |
| Liquidity | Negative share of zero-return days in 126 sessions | More trading activity | Price |
Each month, factor values are winsorised at the 5th/95th percentile and z-scored cross-sectionally:
$$ z_{i,t} = \frac{x_{i,t} - \mu_t}{\sigma_t}. $$The base universe excludes the bottom 30% of price-implied market cap. The long-short portfolio is top versus bottom quintile, equal weight, dollar-neutral, gross exposure 1. The long-only portfolio is the top quintile, equal weight. Rebalancing is monthly at month-end; the holding period is the next month. The base one-way cost is 50 bp of traded notional. The sector-neutral variant subtracts the sector mean before the z-score.
The one that survives
| Factor (long-short) | Net CAGR | Vol | Sharpe | Max DD | Turnover | IC | IC t | Alpha (t) |
|---|---|---|---|---|---|---|---|---|
| Momentum 12-1 | 6.74% | 10.49% | 0.67 | −19.30% | 6.11x | 0.078 | 4.23 | 6.82% (2.50) |
| Value proxy | −5.82% | 10.02% | −0.55 | −55.50% | 4.45x | −0.040 | −2.28 | −5.21% (−1.84) |
| Quality proxy | 0.51% | 9.39% | 0.10 | −33.41% | 4.44x | 0.045 | 2.70 | 1.05% (0.38) |
| Size | 0.46% | 6.75% | 0.10 | −22.34% | 2.56x | −0.003 | −0.22 | 1.78% (0.99) |
| Low volatility | −5.90% | 7.44% | −0.78 | −57.30% | 4.23x | 0.010 | 0.71 | −5.90% (−3.07) |
| Liquidity | −1.00% | 9.92% | −0.05 | −48.94% | 5.32x | −0.018 | −1.01 | −2.75% (−1.10) |
| Equal-weight composite | 1.89% | 9.04% | 0.25 | −16.10% | 6.39x | 0.039 | 2.40 | 1.21% (0.59) |
Momentum, size, low-vol and liquidity run from April 2013. The value proxy starts in April 2015 and quality in November 2014 because they need 36 months of history. The composite starts in April 2013. The table compares each factor over its own available window.
Momentum earns 6.74% net CAGR with 10.49% volatility, a 0.67 Sharpe and a −19.30% maximum drawdown. The IC is 0.078 (t = 4.23): the factor sorted next-month returns correctly in 64.8% of months. The Newey-West alpha is 6.82% (t = 2.50) with a beta of 0.08 to the MASI and an R² of 0.9%. It is not a repackaged index bet.
It is also not a one-period accident. Momentum earns 7.11% in 2014-2019 and 11.41% in 2020-2026; the recent 2024-2026 window is stronger (20.68%), but it is short and should not be extrapolated.
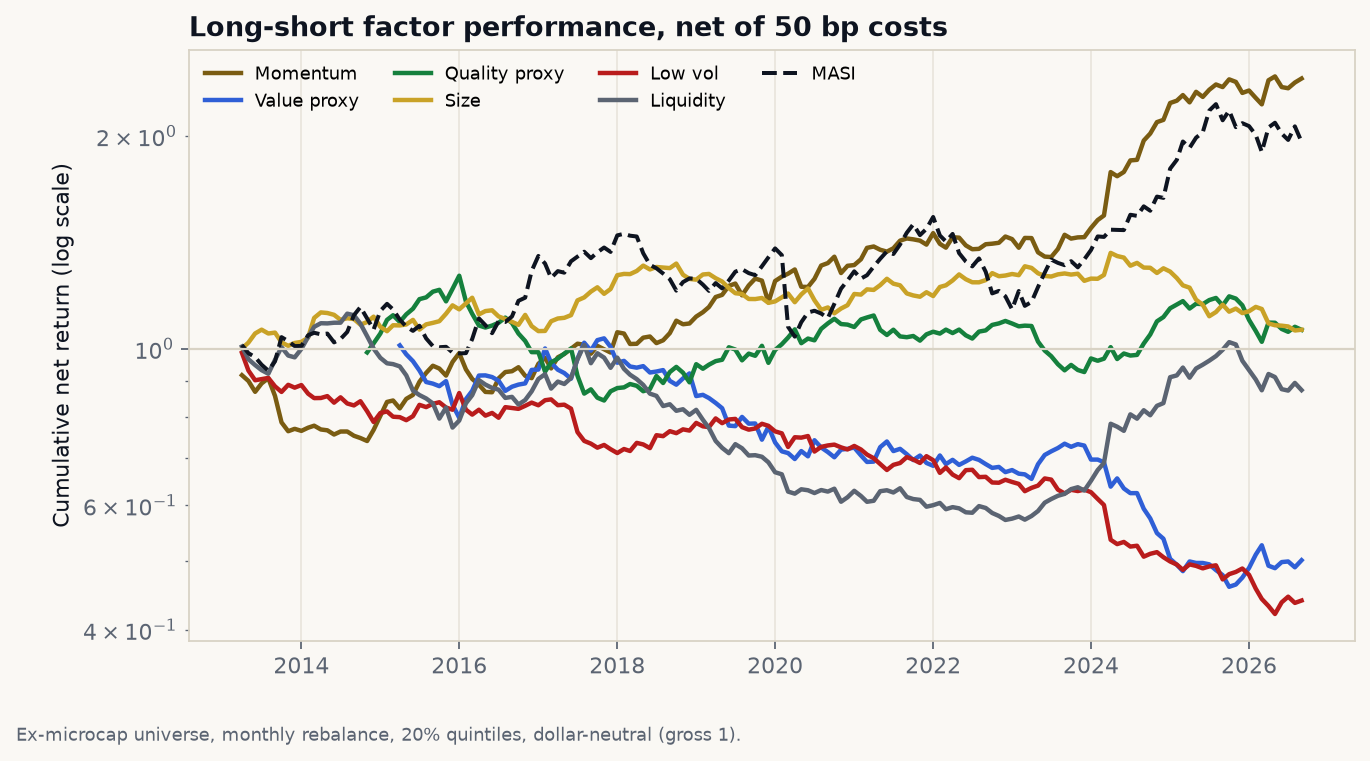
Momentum is the only long-short line that compounds. The MASI is shown as a reference, not as a long-short portfolio. The y-axis is logarithmic.
What does not work
Size is a microcap illusion. On all names, the size factor earns 3.71% net. After excluding the bottom 30% by market cap, it earns 0.46%. Sector-neutral, it is −1.25%. The apparent small-cap premium lives in the microcaps and the illiquid tail, not in a robust large-versus-small spread.
The value proxy is negative. It earns −5.82% net and is negative in every subperiod: −5.22% in 2014-2019, −6.24% in 2020-2026, −12.70% in 2024-2026. That is a result for long-term reversal, not for book-to-price or earnings yield, which we cannot test.
The quality proxy is flat. It earns 0.51% net, with an alpha t of 0.38. The IC is positive (0.045) but the long-short return is not. Return consistency is not a tradable quality factor here.
Low volatility is the wrong way round. It earns −5.90% net, with a significantly negative alpha (t = −3.07) and a −57.30% drawdown. High-volatility stocks won. This is a real result for the low-vol factor in this sample, not a data artefact.
Liquidity does not pay. It earns −1.00% net, with an alpha t of −1.10. The more liquid names did not outperform enough to cover the cost of sorting on a noisy proxy.
The equal-weight composite earns 1.89% net — better than the failing factors individually, but far below momentum alone. The reason is correlation: value and momentum are negatively correlated (−0.57), and value and quality are almost the same factor with opposite signs (−0.89). Adding the failing sleeves dilutes the one working signal.
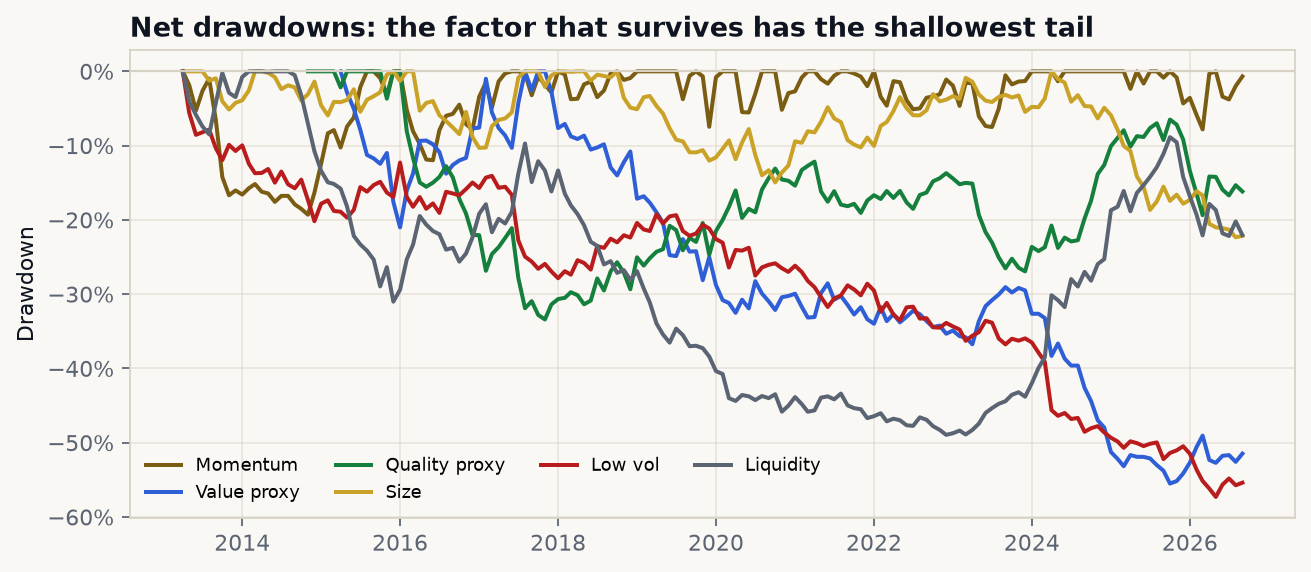
Momentum has the shallowest tail (−19.3%). Low-vol and value draw down by more than 55%.
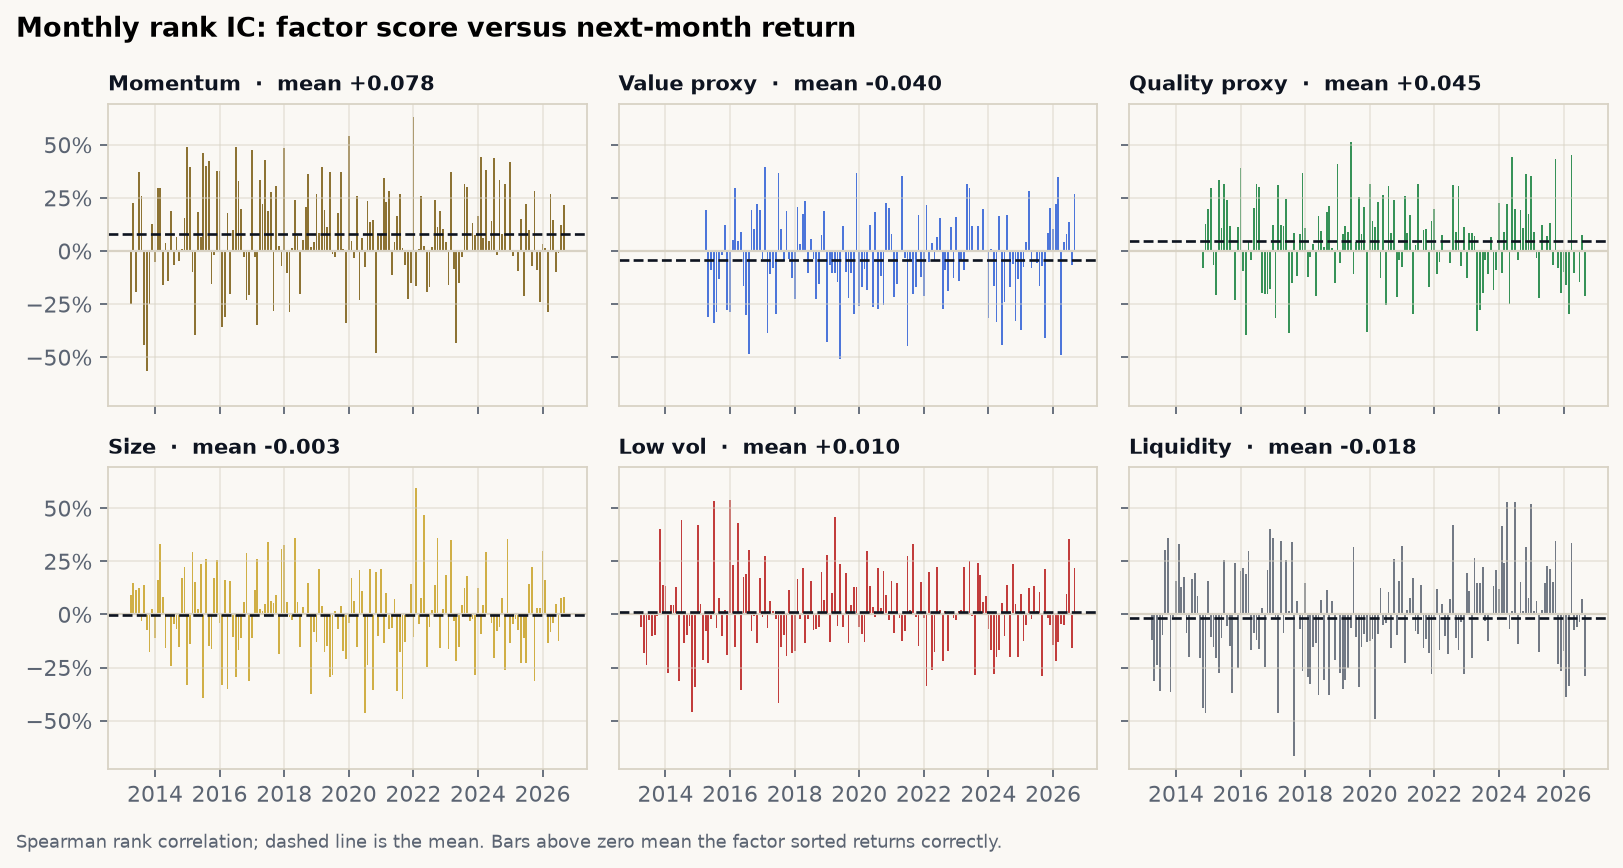
Momentum’s IC is positive and persistent. Value’s is negative. The other factors are close to zero.
Costs: the first catch
Momentum turns over 6.11x capital a year. That is the price of a 12-1 signal that is rebalanced every month. The base case uses 50 bp one-way; the sensitivity is steep:
| One-way cost | Net CAGR | Sharpe | Max DD |
|---|---|---|---|
| 0 bp | 10.02% | 0.96 | −15.15% |
| 25 bp | 8.37% | 0.82 | −16.94% |
| 50 bp | 6.74% | 0.67 | −19.30% |
| 75 bp | 5.13% | 0.53 | −21.60% |
| 100 bp | 3.54% | 0.38 | −23.83% |
| 150 bp | 0.43% | 0.09 | −28.13% |
At 100 bp, the premium halves. At 150 bp, it is gone. The 50 bp assumption is plausible for an institutional BVC broker but not universal; retail, small tickets and wide spreads can be more expensive. The cost model charges the one-way cost on every unit of traded notional and ignores borrow costs, taxes, brokerage minimums and asymmetric impact.
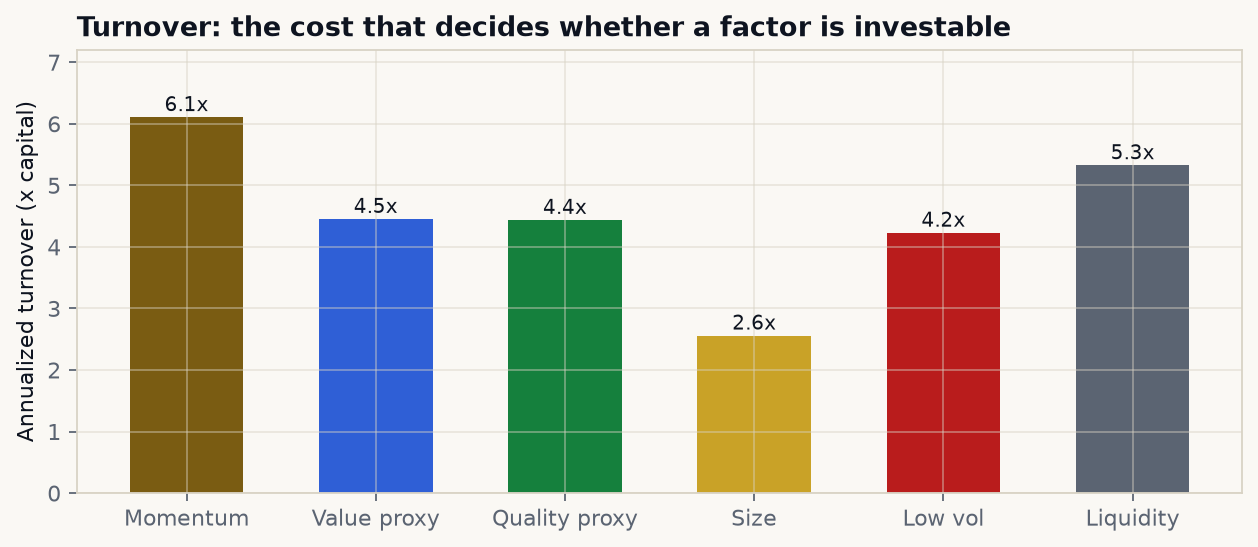
Momentum is not the highest-turnover factor (liquidity is), but 6.1x a year is enough for costs to decide whether the factor is investable.
Capacity: the second catch
The research universe is not investable at scale. It includes names with ADV of a few thousand dirhams; the median 10%-ADV hard cap is only 54k MAD for a 10-name long-only book and 20k MAD for the long-short version. That is a useful diagnostic: a paper factor can be real and still be impossible to implement.
The liquid implementation is the relevant one: 10 names from the ex-microcap universe with current market cap ≥ 500M MAD and current 30-day ADV ≥ 2M MAD. Current ADV is held constant through history, so this is a snapshot capacity, not a time-varying estimate.
| AUM (MAD) | Long-only net CAGR | Max position / ADV | Long-short net CAGR | Max position / ADV |
|---|---|---|---|---|
| 0.5M | 9.56% | 2.4% | 2.57% | 2.5% |
| 1M | 9.40% | 4.7% | 2.26% | 4.9% |
| 2M | 9.18% | 9.5% | 1.83% | 9.9% |
| 5M | 8.74% | 23.7% | 0.98% | 24.7% |
| 10M | 8.25% | 47.3% | 0.03% | 49.4% |
| 20M | 7.55% | 94.7% | −1.30% | 98.8% |
| 50M | 6.18% | 236.7% | −3.89% | 247.1% |
| 500M | −1.60% | 2,366.8% | −17.98% | 2,470.8% |
The 10%-ADV hard cap is 2.50M MAD for the 10-name long-only book and 3.34M MAD for the long-short version. At 2M, the long-only book is below 10% of ADV in every month; at 5M, it breaches in every month. The impact-only breakeven — where the net CAGR turns negative — is much later, at 500M MAD long-only and 20M MAD long-short. The 10%-ADV rule binds long before impact does.
Two caveats matter:
- Shorting is constrained. Individual BVC securities lending is limited. The long-short result is a research measurement, not a guaranteed implementable strategy. The long-only version is the one to capacity-test.
- The ADV snapshot is stale. Current ADV is not historical ADV. If the market has become more liquid over time, the early-period capacity is understated; if it has become less liquid, it is overstated. The direction of the bias is not obvious, and the number should be treated as an order of magnitude, not a commitment.
At 9.5 MAD/USD, 2.5M MAD is about USD 260,000. That is the scale at which a 10-name momentum book stops being a portfolio and starts being a market-moving order. The factor is real; the capacity is not.
The MASI is a large-cap bet
The MASI returned 5.12% CAGR over the factor period, with 12.93% volatility and a 0.45 Sharpe. The equal-weight ex-microcap universe returned 7.63% with 12.45% volatility and a 0.66 Sharpe. The average stock beat the cap-weighted index by about 2.5 points a year with similar volatility.
That gap is a size/equal-weight effect, not a secret quality or momentum factor. The MASI’s largest weights are banks, telecom and mining; the average stock — including smaller names — did better. The 2024-2026 rally was broad, not a handful of winners carrying the index.
The factor evidence is consistent with that reading:
- The momentum long-short has a beta of 0.08 to the MASI and an R² of 0.9%. It is not a repackaged index bet.
- The momentum long-only has a beta of 1.10 and an R² of 44.9%. Its 17.83% CAGR and 21.13% volatility are a high-beta small/mid-cap portfolio, not a market-neutral free lunch.
- Size on all names earns 3.71%, but after microcap exclusion it earns 0.46%. The “small-cap premium” is mostly the microcap tail.
So the honest answer to “is the MASI’s recent return concentration a hidden size/quality/momentum bet?” is: the MASI is a large-cap bet, but the factor premia are not simply the index’s concentration. The index lagged the equal-weight average; momentum is close to market-neutral; size is a microcap effect; and value, quality and low-vol do not deliver a robust premium.
Robustness
Long-short net CAGR by specification:
| Factor | Base ex-micro | All names | Sector-neutral | Liquid | Quarterly | 100 bp | 150 bp |
|---|---|---|---|---|---|---|---|
| Momentum | 6.74% | 3.31% | 5.45% | 5.76% | 7.16% | 3.54% | 0.43% |
| Value proxy | −5.82% | −0.84% | −6.43% | −5.72% | −3.37% | −7.91% | −9.96% |
| Quality proxy | 0.51% | −1.22% | −0.32% | 2.23% | 1.41% | −1.70% | −3.86% |
| Size | 0.46% | 3.71% | −1.25% | 3.30% | 1.25% | −0.82% | −2.08% |
| Low volatility | −5.90% | −7.38% | −5.46% | −5.32% | −4.16% | −7.89% | −9.83% |
| Liquidity | −1.00% | 0.78% | −3.00% | −1.13% | 1.18% | −3.60% | −6.14% |
Momentum survives all-names, sector-neutral, liquid-universe and 100 bp. It does not survive 150 bp. The quarterly result is higher (7.16%) but carries a −42.25% maximum drawdown and 2.03x turnover: holding the same book for three months cuts trading costs but deepens the tail. The monthly version has a much shallower drawdown (−19.30%) because it can exit losers sooner.
The multiple-testing caveat is real. Six factors were pre-specified and all are reported; a t-stat of 2.5 on the best of six is not overwhelming. The IC t-stat of 4.23, the positive IC in 64.8% of months, and the stability across both subperiods are reassuring, but they do not turn a 13-year BVC sample into a law of nature.
Move the factors yourself
Scroll to load the interactive factor lab.
The widget blends the precomputed factor return streams. Set the weights, choose long-only or long-short, the number of names and the one-way cost. The performance, drawdown, turnover and key statistics update in the browser.
Three disclosures:
- It is an approximation. The JavaScript does not rerun the cross-sectional sort. It blends the factor series and applies the chosen cost to the blended turnover. The full Python backtest is the reference.
- It starts in 2015. The 36-month value and quality proxies need history; the common window is shorter than the static tables.
- It does not impose the 10%-ADV cap. The capacity table above is the implementation constraint; the widget is the factor research.
The widget opens on Momentum only, the headline result. Switch to Equal weight to see what happens when you add the failing factors: the return blend is close to zero, and the engine’s composite-score version earns only 1.89% net, not 6.74%.
Limitations
- No point-in-time fundamentals. Value and quality are price-based proxies. The current fundamental snapshot is not used in the backtest.
- Survivorship bias. The cache is built from a current screen; names that delisted earlier are missing. The 74 current names are survivors.
- Price-only data. Closes, not total returns; dividends and splits are not adjusted. Long-only returns are understated relative to a total-return portfolio.
- Price-implied size. Today’s share count is applied to historical prices; issuance, buybacks and splits are not adjusted.
- Stale and illiquid marks. The median zero-return share is 14.3% (p90 26.2%); the 21-day staleness filter helps but does not eliminate stale marks.
- No historical ADV. Capacity uses current 30-day ADV held constant. It is a snapshot, not a time-varying estimate.
- Shorting constraints. BVC securities lending is limited; the long-short results are a research measurement, not a guaranteed implementation.
- Cost assumptions. 50 bp one-way is an assumption; the sensitivity is 0-150 bp. No borrow cost, taxes, brokerage minimums or asymmetric impact.
- Multiple testing. Six factors, all reported. The best result is not a law of nature.
- Short recent window. The 2024-2026 momentum result is very strong (20.68% long-short) and should not be extrapolated.
- No risk-free rate. Sharpe uses rf = 0. At the 2.25% BAM policy rate, Sharpe ratios would be lower.
- No taxes. Returns are pre-tax.
- Data source risk. The screen and fundamentals come from TradingView’s CSEMA scan; the MASI from the cached FIN/derivatives-lab series. Neither is an official BVC constituent/weight history.
Résumé français
Les données. Le laboratoire repose sur 76 historiques de prix de la BVC du 26 mars 2012 au 14 octobre 2026, et sur l’écran courant de 74 valeurs au 16 octobre 2026. Deux valeurs du cache (DRI, EQD) ne sont plus dans l’écran. L’univers de base compte en médiane 57 valeurs, l’univers hors microcaps 39, l’univers liquide 14. L’ADV médian est de 0,92 M MAD ; 28 valeurs dépassent 2 M MAD d’ADV. La part de jours à rendement nul est de 14,3 % en médiane et 26,2 % au 90e percentile : le marché est peu liquide, et les prix mensuels peuvent être marqués sur des cours anciens.
Pourquoi pas de value ni de quality fondamentales. Le cache ne contient qu’un instantané courant de P/E (60/74), P/B (62/74), ROE (65/74), levier (68/74) et rendement du dividende (56/74). Il n’y a pas de panel point-in-time de valeur comptable, de bénéfices, d’EBITDA, de dette, d’actions ou de dividendes sur 2012-2026. Les rapports annuels locaux ne couvrent que huit sociétés, avec des années incomplètes. Je n’ai donc pas fabriqué d’historique fondamental. Les deux manches « value » et « quality » sont des proxys de prix : le rendement 36-1 négatif (retournement long terme) et la régularité des rendements sur 36 mois (moyenne / écart-type). Ce ne sont pas des facteurs value ou quality fondamentaux ; un résultat négatif sur le proxy de retournement ne prouve pas que l’investissement value échoue à Casablanca.
Le résultat principal. Le momentum 12-1 est le seul facteur qui survit. En long-short, il rapporte 6,74 % de CAGR net après 50 pb de coûts, avec 10,49 % de volatilité, un Sharpe de 0,67, un drawdown maximal de −19,30 %, un turnover de 6,11x et un IC de 0,078 (t = 4,23). L’alpha Newey-West est de 6,82 % (t = 2,50), avec un bêta de 0,08 au MASI : ce n’est pas un pari déguisé sur l’indice. Il est positif sur les deux sous-périodes : 7,11 % en 2014-2019 et 11,41 % en 2020-2026. Il résiste à l’univers complet (3,31 %), à la neutralisation sectorielle (5,45 %), à l’univers liquide (5,76 %) et à 100 pb de coûts (3,54 %). À 150 pb, il tombe à 0,43 % : la prime disparaît.
Ce qui ne marche pas. Le size rapporte 3,71 % sur toutes les valeurs, mais seulement 0,46 % hors microcaps et −1,25 % en neutre sectoriel : c’est un effet microcap/illiquidité, pas une prime robuste. Le proxy value perd −5,82 % et reste négatif sur toutes les sous-périodes. Le proxy quality gagne 0,51 % (alpha t = 0,38) : pas significatif. Le low-vol perd −5,90 % (alpha t = −3,07) : les valeurs volatiles ont gagné. La liquidité perd −1,00 %. Le composite équipondéré ne rapporte que 1,89 %, car value et momentum sont corrélés négativement (−0,57) et value et quality sont presque le même facteur avec des signes opposés (−0,89).
Les coûts. Le momentum tourne 6,11x par an. À 0 pb, il rapporte 10,02 % ; à 25 pb, 8,37 % ; à 50 pb, 6,74 % ; à 75 pb, 5,13 % ; à 100 pb, 3,54 % ; à 150 pb, 0,43 %. Les coûts ne sont pas un détail : ils décident si le facteur est investissable. Le modèle ignore le coût d’emprunt, les taxes, les minima de courtage et l’impact asymétrique.
La capacité. L’univers de recherche n’est pas investissable à l’échelle : sa capacité médiane à 10 % de l’ADV n’est que de 54 k MAD pour un portefeuille long-only de 10 lignes et 20 k MAD en long-short, car il contient des valeurs très peu liquides. L’implémentation liquide — 10 valeurs, capitalisation ≥ 500 M MAD, ADV ≥ 2 M MAD — est la bonne référence. Sa capacité à 10 % de l’ADV est de 2,50 M MAD en long-only et 3,34 M MAD en long-short. À 2 M MAD, le portefeuille long-only reste sous 10 % de l’ADV chaque mois ; à 5 M MAD, il dépasse la limite chaque mois. Le seuil où l’impact seul annule le rendement est beaucoup plus tard (500 M MAD en long-only, 20 M MAD en long-short), mais la règle des 10 % de l’ADV mord bien avant. À 9,5 MAD/USD, 2,5 M MAD représentent environ 260 000 USD : c’est l’échelle où un portefeuille de 10 lignes devient un ordre qui déplace le marché. La capacité est calculée avec l’ADV courant, tenu constant sur l’historique : c’est un instantané, pas une série point-in-time.
Le MASI. Le MASI a rapporté 5,12 % de CAGR sur la période, avec 12,93 % de volatilité et un Sharpe de 0,45. L’univers équipondéré hors microcaps a rapporté 7,63 %, avec 12,45 % de volatilité et un Sharpe de 0,66. L’écart d’environ 2,5 points par an est un effet size/équipondération, pas un facteur quality ou momentum caché. Le momentum long-short a un bêta de 0,08 au MASI ; le momentum long-only a un bêta de 1,10 et un R² de 44,9 %, donc c’est un portefeuille actions à bêta élevé, pas un alpha neutre au marché. La concentration du MASI dans les banques, les télécoms et les mines a fait laguer l’indice par rapport à la moyenne des actions ; le rallye 2024-2026 a été large, pas porté par une poignée de gagnants.
Les limites. Pas de fondamentaux point-in-time ; biais de survie (le cache vient d’un écran courant) ; prix de clôture sans dividendes ni ajustement des splits ; capitalisation reconstruite avec le nombre d’actions courant ; cours parfois obsolètes ; pas d’ADV historique ; contraintes de vente à découvert sur la BVC ; coûts et fiscalité approximatifs ; six facteurs testés, donc un risque de multiple testing ; échantillon de 13 ans avec un régime récent très fort. Le résultat principal n’est pas une loi de la nature : c’est une prime robuste dans cet échantillon, avec une capacité faible.
Reproducibility
cd casablanca-factor-lab
python3 -m venv .venv
source .venv/bin/activate
pip install -r requirements.txt

python3 factor_lab.py selftest
python3 factor_lab.py analyze
python3 -m unittest discover -s tests -v
Data: Bourse de Casablanca / TradingView CSEMA daily closes and current screen, value date 16 October 2026; MASI daily closes, 26 March 2012 to 14 October 2026. The data payload behind the interactive exhibits is published at /data/factor-lab.json; the methodology and tests are documented in this case study.
Not investment advice. This is an independent research exercise on public data, not a recommendation on any security. Past factor returns are not a forecast. The value and quality sleeves are price-based proxies, not point-in-time fundamental factors.
