Table of Contents
- The question a return chart cannot answer
- The book: rules, not names
- What the data will and will not support
- The result: 9.7% against 5.0%
- The attribution: allocation, selection and the linking problem
- What the factors say
- Costs: the excess is not free
- Robustness
- Limitations
- Move the attribution yourself
- Résumé français
- Reproducibility
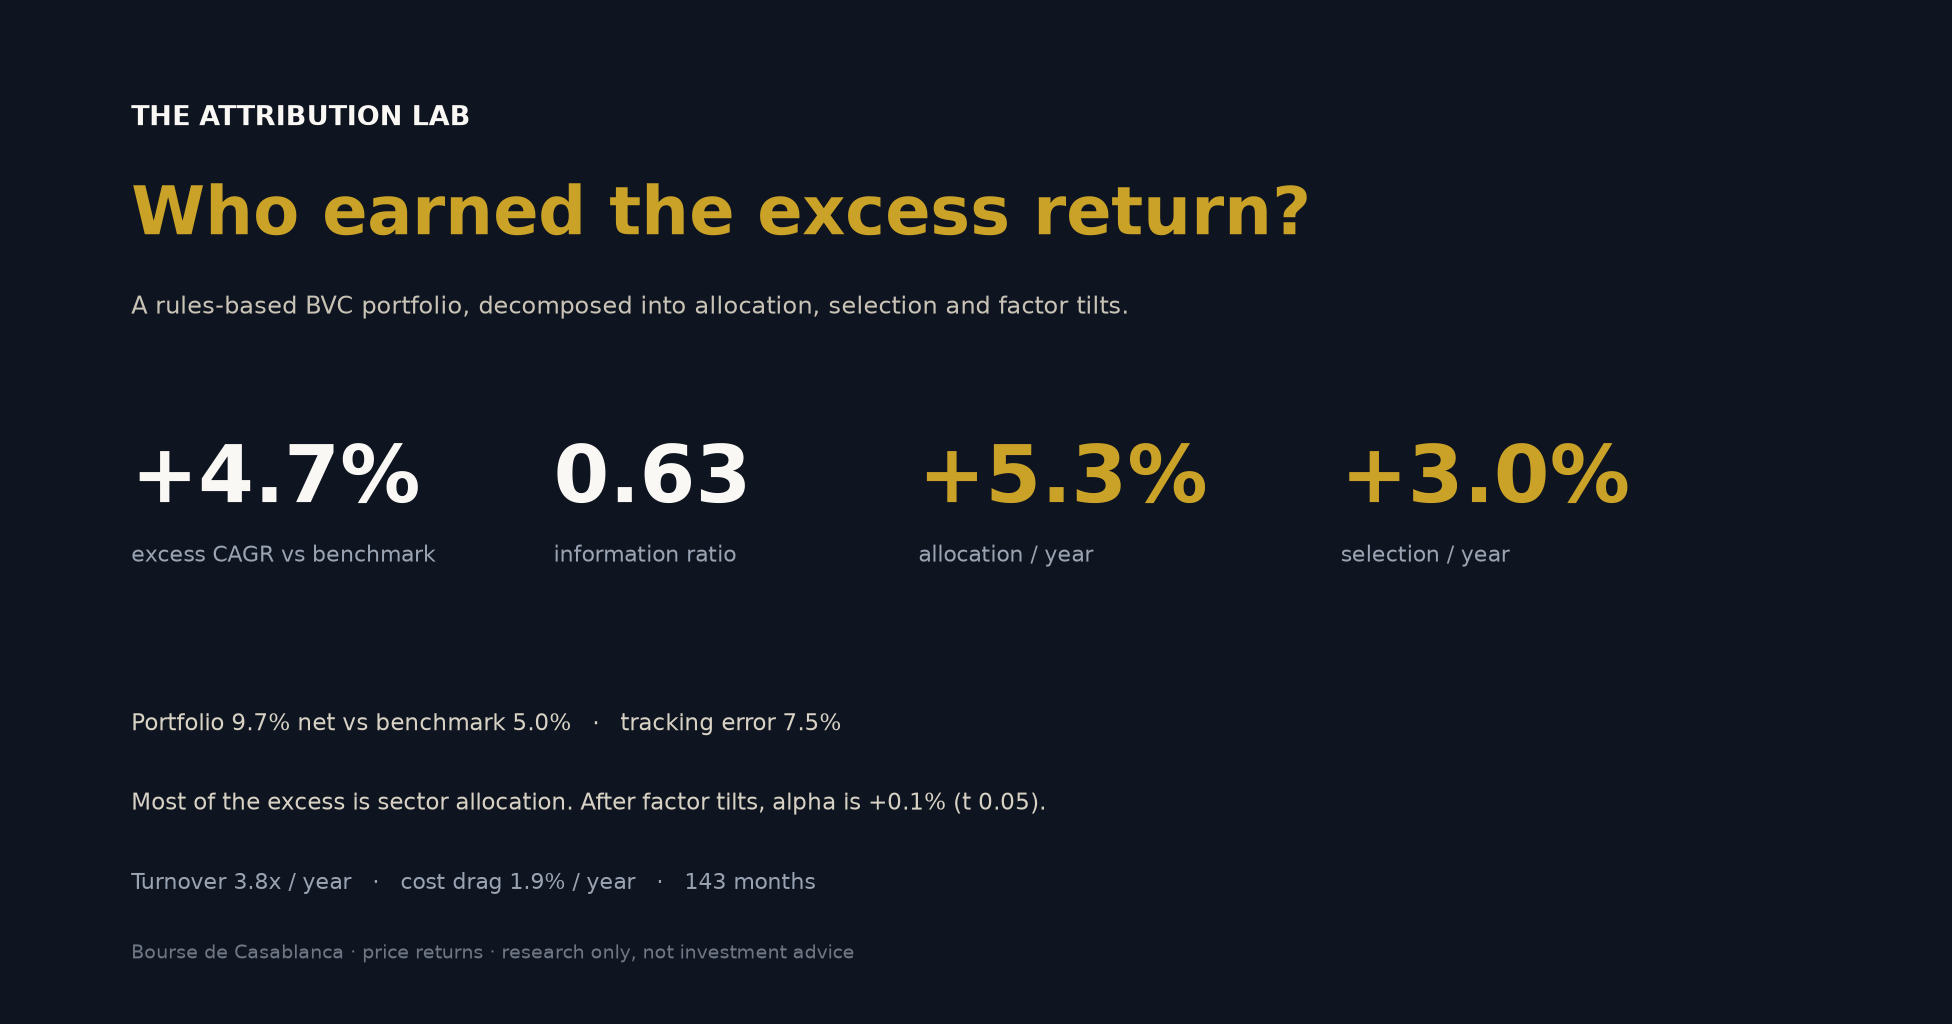
In one paragraph. A return chart says the portfolio won. It does not say who won it. This lab takes a rules-based 15-name BVC portfolio and decomposes its 143 months (November 2014 to September 2026) against a cap-weighted BVC benchmark. The book compounds at 9.73% net versus 5.04%, a 4.69% annual excess with a 0.63 information ratio, 7.48% tracking error and a -28.71% maximum drawdown (the benchmark’s is -28.87%). Brinson-Fachler attribution, linked with Carino, puts +5.29% a year on sector allocation, +3.00% on selection, -1.70% on interaction and -1.92% on costs. A Newey-West regression on the five price-based factors leaves an alpha of +0.09% (t = 0.05, R² = 0.47): momentum (+3.57% a year) and size (+0.57%) explain the rest. The honest reading is that the excess is a systematic sector and factor bet, not stock-picking skill — and it is unevenly earned. Excluding 2024, the excess CAGR falls to 2.37% and the information ratio to 0.36.
Résumé (français). Un graphique de performance dit que le portefeuille a gagné ; il ne dit pas qui a gagné. Ce laboratoire décompose 143 mois (novembre 2014 – septembre 2026) d’un portefeuille BVC règles-based de 15 lignes face à un indice BVC pondéré par capitalisation. Le livre compose à 9,73 % net contre 5,04 %, soit 4,69 % d’excès annuel, un ratio d’information de 0,63, un tracking error de 7,48 % et un drawdown maximal de -28,71 % (contre -28,87 % pour l’indice). L’attribution Brinson-Fachler, chaînée par Carino, attribue +5,29 % par an à l’allocation sectorielle, +3,00 % à la sélection, -1,70 % à l’interaction et -1,92 % aux coûts. Une régression Newey-West sur cinq facteurs de prix laisse un alpha de +0,09 % (t = 0,05, R² = 0,47) : le momentum (+3,57 % par an) et le size (+0,57 %) expliquent le reste. La lecture honnête : l’excès est un pari systématique sur les secteurs et les facteurs, pas une preuve de stock-picking — et il est inégalement réparti. Hors 2024, l’excès tombe à 2,37 % et le ratio d’information à 0,36.
The question a return chart cannot answer
A performance table answers “did the book beat the benchmark?” Attribution answers a harder question: which decisions did the beating? For a long-only equity book, the active return is the sum of three choices:
- Allocation — overweighting sectors that beat the market and underweighting those that lagged.
- Selection — owning the right stocks inside each sector.
- Interaction — the cross-term between the two.
Then there is a fourth, less flattering line: costs. A portfolio that earns 4.7% of gross active return and pays 1.9% to trade it is a different product from one that keeps the 4.7%.
This lab builds the book first, then measures it three ways: Brinson-Fachler sector attribution, a returns-based factor regression, and a gross-to-net trading bridge. The point is not to produce a prettier return chart. It is to see whether the return survives the explanation.
The book: rules, not names
The portfolio is deliberately mechanical. Every month, at the month-end close, it ranks the investable BVC universe on three price-based signals and buys the top names, equal-weight, subject to a sector cap. There is no discretionary overlay and no name chosen with hindsight.
| Rule | Setting |
|---|---|
| Universe | Ex-microcap: the bottom 30% of the BVC by price-implied market cap is excluded |
| Signal | Equal-weight z-scores of momentum (12-1), quality proxy (36-month return consistency) and low-volatility (126-day) |
| Names | 15 (10 and 20 in robustness) |
| Sector cap | 30% of the book |
| Name cap | 10% |
| Rebalance | Monthly: signal at month-end t, hold the next month |
| Costs | 50 bp one-way on traded notional |
| Benchmark | Cap-weighted BVC universe; MASI for reference |
| Cash | Residual when fewer than 10 names pass the cap |
Two definitions matter. The quality sleeve is not ROE or gross profitability. It is the trailing 36-month mean monthly return divided by its standard deviation — a return-consistency proxy. The value and size sleeves are standalone and robustness books, not part of the balanced composite; value is the negative 36-1 month return, a long-term reversal proxy. There are no point-in-time fundamentals in the data, so calling either a fundamental factor would be dishonest.
The factor definitions are the ones from the Casablanca Factor Lab. The difference is the question: the factor lab asked whether the factors earn a premium; this lab asks how much of a real portfolio’s return is just those factors in disguise.
What the data will and will not support
The panel is built from the same cached BVC data as the factor lab: 76 price histories from 26 March 2012 to 14 October 2026, a current screen of 74 names, and the MASI daily close. Two cached names (DRI, EQD) are no longer in the current screen.
| Data item | What it is |
|---|---|
| Cached BVC names | 76 |
| Current screen | 74 |
| Cached but not current | DRI, EQD |
| Daily coverage | 26 Mar 2012 → 14 Oct 2026 |
| Monthly panel | Mar 2012 → Sep 2026 |
| Portfolio window | Nov 2014 → Sep 2026 (143 months) |
| Median ex-micro universe | 39 names |
| Median zero-return share (126d) | 14.3% |
| Median staleness at month-end | 0 calendar days |
| Sectors | 16 + Unclassified |
| Median current ADV | 0.92M MAD (28 names above 2M MAD) |
The portfolio window is shorter than the panel because the slow signals need history: momentum needs 12 months, the quality proxy 30-36 months, and the value proxy 36 months. The book starts in November 2014, not 2012. The factor regression starts in April 2015 (138 months) because the value factor needs its full 36-month window; the attribution tables use all 143 portfolio months.
The binding constraints are the ones from the factor study:
- No point-in-time fundamentals. The screen has a current P/E, P/B, ROE, leverage and dividend yield. It has no history of book value, earnings, debt, shares or dividends. Quality and value are price-based proxies, not fundamental factors.
- Price-implied market cap. Today’s share count is applied to historical closes. Share issuance, buybacks and splits are not adjusted. The cap-weighted benchmark inherits the same approximation.
- Current sector labels. The 2026 GICS-style sectors are applied to the whole history. Historical classifications may differ.
- Survivorship. The cache is built from a current screen. Names that left the BVC before it was built are not observable.
- Price returns only. Dividends are excluded from the portfolio and both benchmarks.
- No official MASI constituent weights. The Brinson benchmark is a cap-weighted BVC universe built from the same panel. The MASI is reported as a reference comparator, not used for the sector decomposition.
The result: 9.7% against 5.0%
The balanced book earns 9.73% net CAGR against 5.04% for the cap-weighted BVC universe — a 4.69% annual excess. The MASI, a price index, earns 4.62% over the same window, so the portfolio’s excess against the official index is 5.11%. The two benchmarks differ by about half a point a year, which is the gap between the constructed universe and the official index.
| Book | Net CAGR | Benchmark | Excess | Volatility | Sharpe (rf = 0) | Max DD | IR | Turnover | Cost drag |
|---|---|---|---|---|---|---|---|---|---|
| Balanced | 9.73% | 5.04% | +4.69% | 15.63% | 0.67 | -28.71% | 0.63 | 3.8x | 1.92% |
| Momentum | 12.77% | 5.25% | +7.52% | 16.74% | 0.80 | -32.48% | 0.73 | 5.0x | 2.50% |
| Quality | 7.09% | 5.04% | +2.05% | 15.41% | 0.52 | -32.75% | 0.28 | 3.4x | 1.69% |
| Size | 6.93% | 5.25% | +1.68% | 13.81% | 0.56 | -37.73% | 0.16 | 3.7x | 1.84% |
| Low volatility | 3.73% | 5.25% | -1.53% | 12.60% | 0.36 | -27.06% | -0.25 | 3.1x | 1.54% |
| Value proxy | 3.35% | 5.22% | -1.87% | 14.24% | 0.30 | -43.02% | -0.18 | 4.5x | 2.27% |
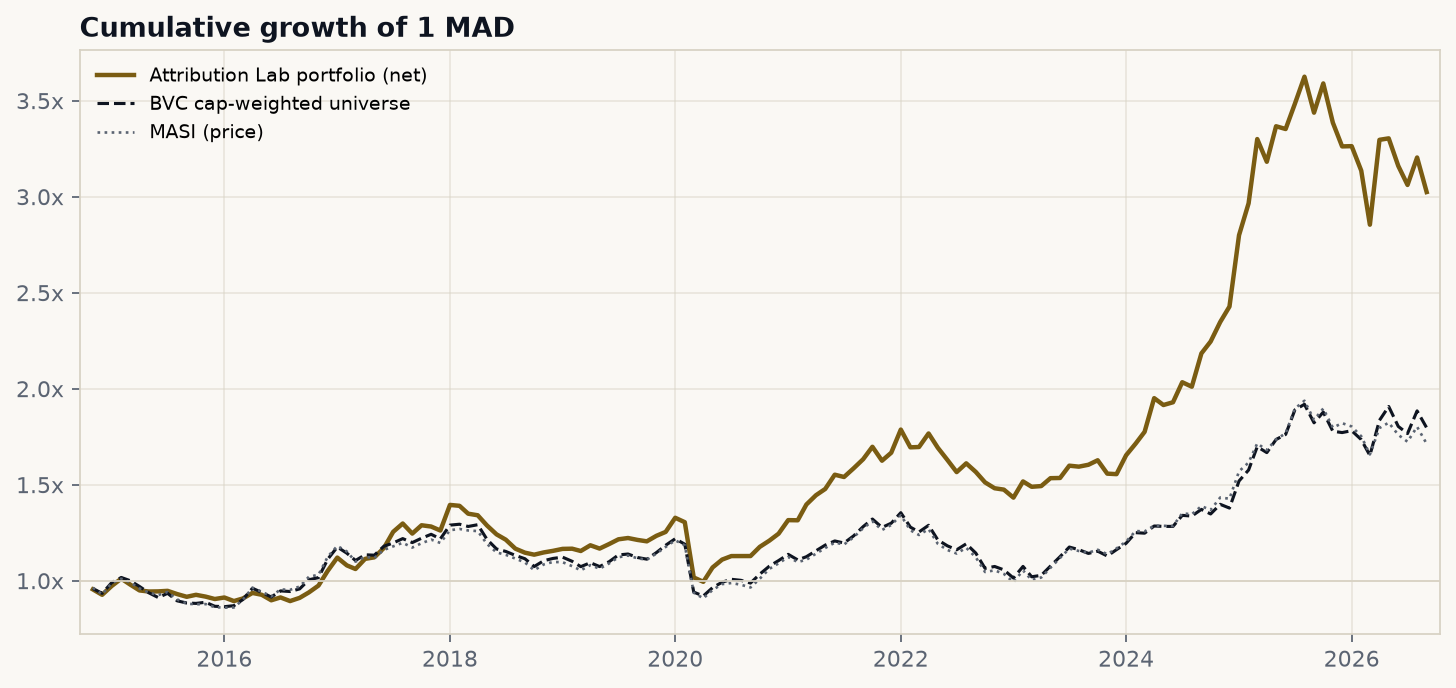
The book compounds to about 3.4x over 143 months; the benchmark and the MASI end near 2.0x. The gap is not a straight line: most of it is earned after 2020, and 2024 is an outlier year.
The risk numbers are as important as the return. The portfolio’s volatility is 15.63%, its maximum drawdown -28.71% — essentially the same as the benchmark’s -28.87%. The excess is not a leverage story. The beta to the benchmark is 1.01. The information ratio of 0.63 is respectable, but it is not a market-neutral alpha; it is an active equity book with a sector and factor tilt.
The concentration is real. Momentum alone earns 12.77%; the balanced blend, which also holds quality and low-vol, earns 9.73%; quality alone 7.09%; size 6.93%; low-vol 3.73%; the value proxy 3.35%. The blend is not a diversifier — it dilutes momentum with two sleeves that did not work. The factor lab reached the same conclusion from the long-short side.
The attribution: allocation, selection and the linking problem
For each month and sector s, Brinson-Fachler decomposes the active return into:
$$ A_s = (w_{p,s} - w_{b,s})(r_{b,s} - r_b), \qquad S_s = w_{b,s}(r_{p,s} - r_{b,s}), \qquad I_s = (w_{p,s} - w_{b,s})(r_{p,s} - r_{b,s}). $$The three effects sum to the portfolio’s gross active return in that month. Over 143 months they do not simply add up to the cumulative active return, because the portfolio compounds. Carino (1999) solves that with a scaling factor:
$$ \kappa_t = \frac{\ln(1+R_{p,t}) - \ln(1+R_{b,t})}{R_{p,t} - R_{b,t}}, \qquad K = \frac{\ln(1+R_p) - \ln(1+R_b)}{R_p - R_b}, \qquad E_k = \sum_t \frac{\kappa_t}{K} e_{k,t}. $$The linked effects sum exactly to the cumulative arithmetic active return (portfolio minus benchmark). I report both views because they answer different questions: the annualized average is the intuitive “how much per year”, while the Carino-linked cumulative is the rigorous “how much of the total arithmetic excess”.
| Component | Annualized average | Carino-linked cumulative |
|---|---|---|
| Allocation | +5.29% | +144.5% |
| Selection | +3.00% | +83.6% |
| Interaction | -1.70% | -51.6% |
| Cost | -1.92% | -53.8% |
| Total | +4.68% | +122.8% |
The annualized column sums to the mean monthly active return times 12. The linked column sums to the cumulative arithmetic active return, which is large because the book compounded at 9.7% against a 5.0% benchmark. The two columns should not be mixed.
The headline is not close: allocation did most of the work. A 30% sector cap forces the book to underweight Finance, which is roughly 43% of the cap-weighted benchmark, and to spread the rest across smaller sectors. That structural bet, not a stock-picking insight, is the largest single source of excess.
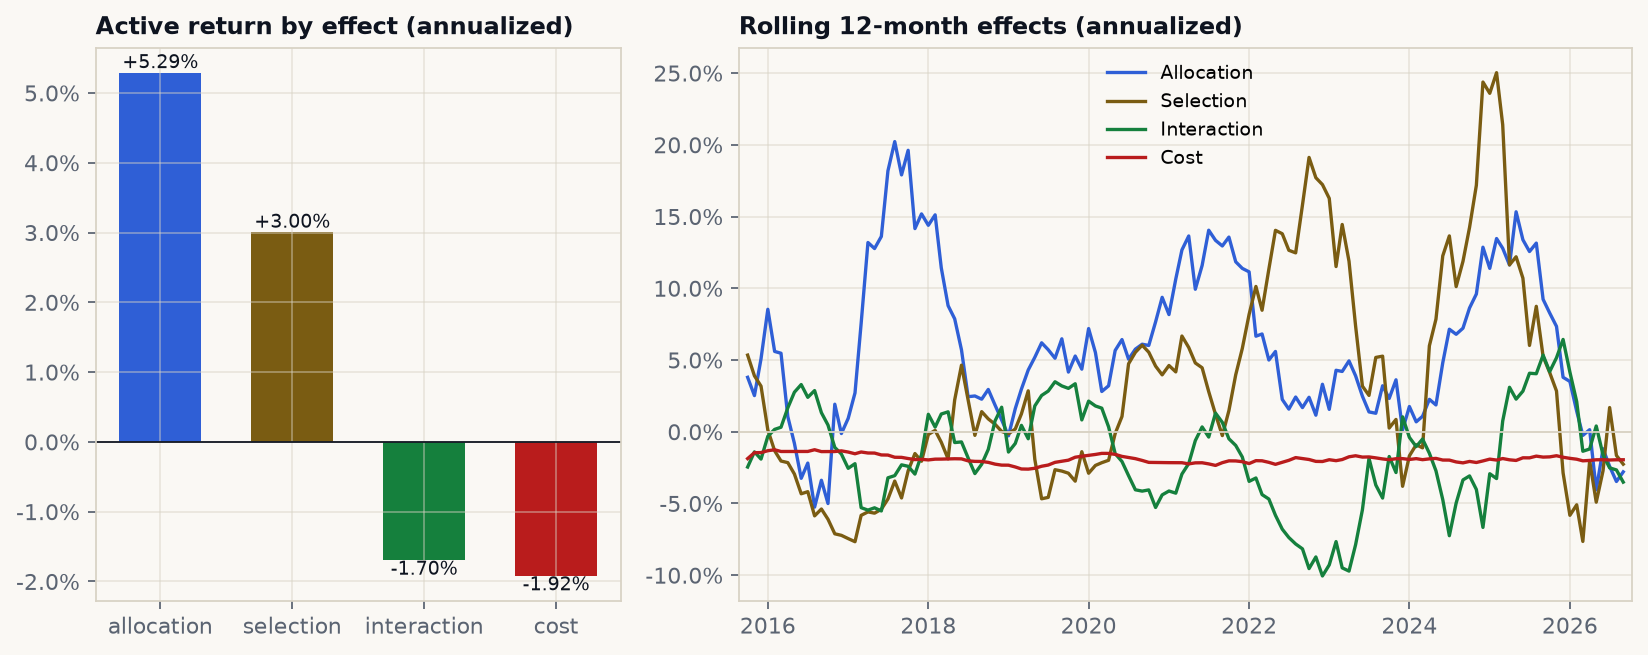
Left: annualized allocation, selection, interaction and cost. Right: the same effects on a rolling 12-month window. Allocation is positive in most years but collapses in the 2014-2016 and 2026 windows; selection is far more volatile.
The sector detail is where the allocation story becomes concrete:
| Sector | Allocation / yr | Selection / yr |
|---|---|---|
| Finance | +0.46% | +3.51% |
| Technology Services | +1.54% | -0.05% |
| Industrial Services | +1.06% | -0.03% |
| Communications | +0.85% | +0.39% |
| Transportation | +0.75% | -0.07% |
| Health Services | -0.90% | -0.76% |
| Utilities | -0.02% | -0.31% |
| Non-Energy Minerals | +0.01% | -0.10% |
Finance selection is the single largest line: +3.51% a year. It is not proof of bank-picking skill. The portfolio’s Finance names are mostly real-estate developers (ADI, ADH), while the benchmark’s Finance weight is dominated by banks (BCI, CIH, BOA). The factor regression shows that this is largely a momentum and size tilt inside the sector.
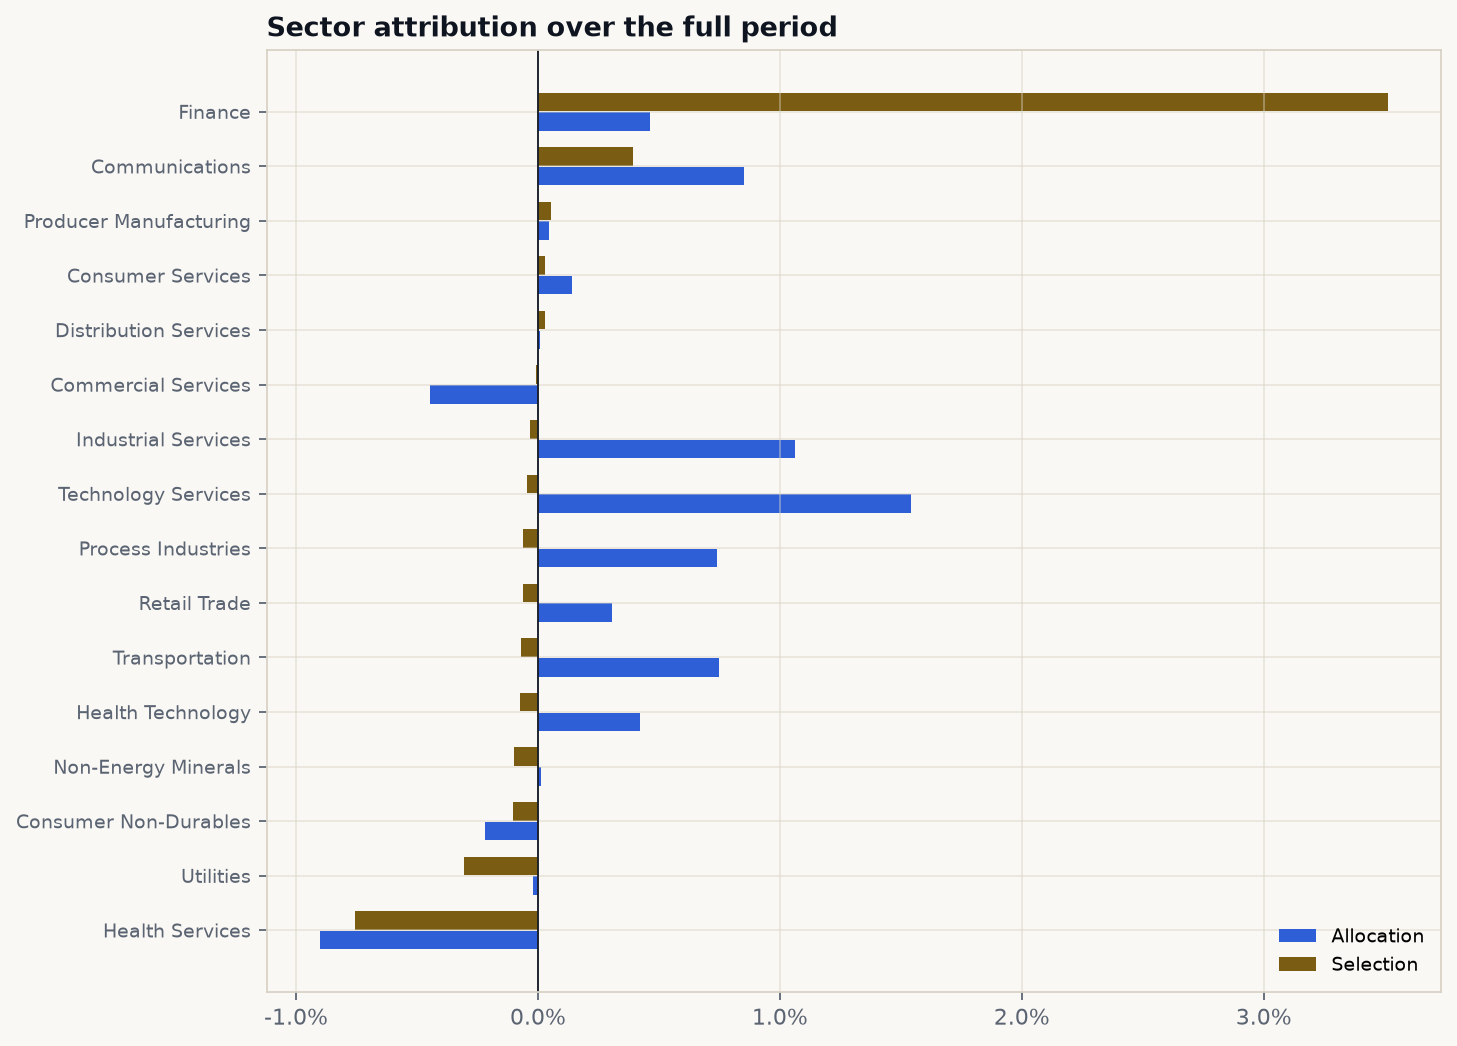
Allocation (blue) and selection (gold) by sector. Finance selection dominates; Technology Services and Industrial Services contribute through allocation, not selection; Health Services and Utilities subtract.
What the factors say
A sector decomposition can flatter a systematic strategy. If the portfolio is simply long momentum and small caps, the “selection” effect inside Finance is a factor exposure, not skill. The test is a returns-based regression of the net active return on the five price-based factor long-short returns, with Newey-West standard errors (three lags):
$$ R_{p,t} - R_{b,t} = \alpha + \sum_k \beta_k F_{k,t} + \varepsilon_t. $$| Factor | Beta | t | Mean monthly | Contribution / yr |
|---|---|---|---|---|
| Momentum | 0.28 | 4.15 | +1.05% | +3.57% |
| Size | 0.43 | 4.87 | +0.11% | +0.57% |
| Low volatility | -0.11 | -1.23 | -0.24% | +0.32% |
| Value proxy | -0.09 | -0.76 | -0.27% | +0.28% |
| Quality proxy | 0.08 | 0.72 | +0.18% | +0.18% |
| Alpha | +0.09% (t = 0.05) | |||
| R² | 0.47 | |||
| Mean active | +5.02% | |||
| Explained | +4.93% |
138 months (April 2015 to September 2026), the window in which all five factors are available. The full portfolio window is 143 months.
The regression is unambiguous. Momentum and size are the only exposures with meaningful t-statistics. Together with the smaller low-vol, value and quality tilts, they explain 4.93 of the 5.02 points of mean active return in the regression window. The residual alpha is +0.09% a year, t = 0.05 — statistically indistinguishable from zero.
That does not mean the sector allocation was irrelevant. It means the sector allocation and the factor tilts are two descriptions of the same bet. The portfolio’s persistent underweight in Finance, its overweight in smaller sectors, and its momentum tilt are all part of one systematic posture. Calling it “selection” because it shows up inside the Brinson sector line would be a category error.
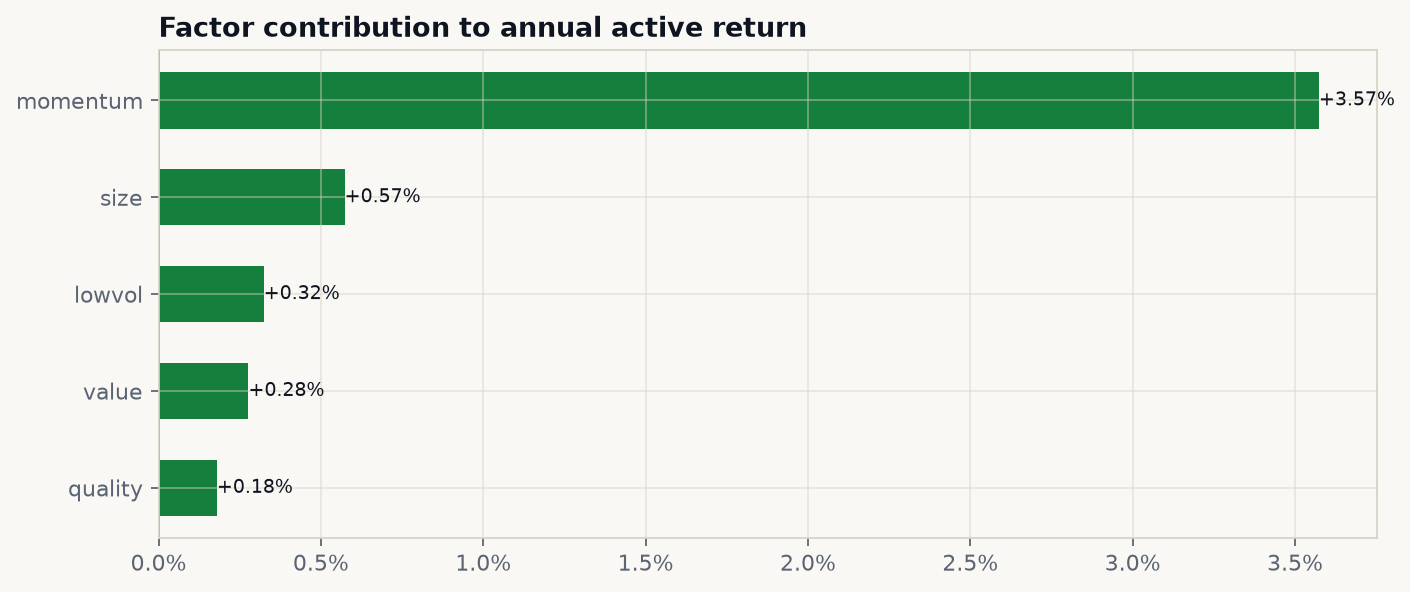
Momentum contributes +3.57% a year and size +0.57%. The other three factors are economically small and statistically weak. The residual alpha is effectively zero.
Costs: the excess is not free
The book turns over 3.8x a year. At 50 bp one-way, the cost drag is 1.92% a year — about 41% of the gross excess. The cost sensitivity is steep:
| One-way cost | Net CAGR | Excess CAGR | Information ratio | Cost drag |
|---|---|---|---|---|
| 0 bp | 11.85% | +6.81% | 0.88 | 0.00% |
| 25 bp | 10.78% | +5.75% | 0.75 | 0.96% |
| 50 bp | 9.73% | +4.69% | 0.63 | 1.92% |
| 75 bp | 8.69% | +3.65% | 0.50 | 2.88% |
| 100 bp | 7.65% | +2.61% | 0.37 | 3.84% |
| 150 bp | 5.61% | +0.57% | 0.11 | 5.76% |
At 150 bp the excess is +0.57% a year — inside the noise. The result is investable at institutional Moroccan costs, but not at a cost level that ignores BVC liquidity, brokerage minimums and market impact.
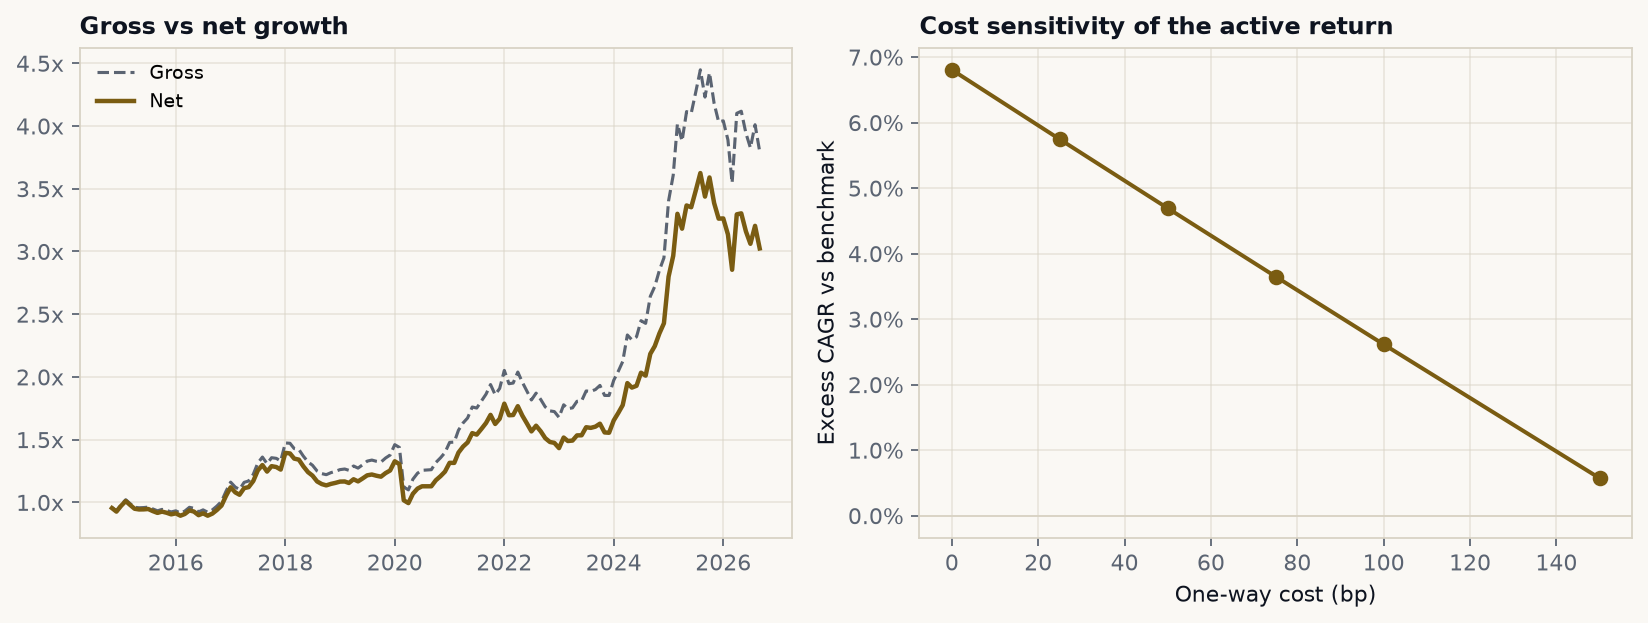
The gross-to-net gap is the cost bridge. The right panel shows the excess CAGR collapsing roughly linearly with the assumed one-way cost.
Robustness
The result is not a single specification.
By style and number of names (excess CAGR, 50 bp, 30% sector cap):
| Style | 10 names | 15 names | 20 names |
|---|---|---|---|
| Balanced | +6.88% | +4.69% | +2.78% |
| Momentum | +11.61% | +7.52% | +4.51% |
| Quality | +2.95% | +2.05% | +2.00% |
| Size | +3.60% | +1.68% | +2.46% |
| Low volatility | -1.52% | -1.53% | -0.46% |
| Value proxy | +0.38% | -1.87% | -1.56% |
Concentration helps the books that work: the 10-name balanced portfolio earns 12.0% net and a 0.73 information ratio; 10-name momentum earns 16.9% and 0.85. It also raises tracking error and drawdown. Value and low-vol fail at every size. The sector cap costs a little return (15 names: 4.69% with the cap versus 4.82% without; 20 names: 2.78% versus 3.35%) but is a genuine risk control, not a return enhancer.
By subperiod (annualized effects):
| Period | Net CAGR | Benchmark | Excess | Allocation | Selection | Interaction | Cost |
|---|---|---|---|---|---|---|---|
| 2016-2019 | 8.51% | 8.12% | +0.39% | +5.06% | -2.66% | -0.15% | -1.82% |
| 2020-2022 | 5.54% | -3.74% | +9.28% | +8.02% | +9.00% | -5.40% | -2.10% |
| 2023-2026 | 21.12% | 15.21% | +5.91% | +3.87% | +4.15% | -0.41% | -1.92% |
The excess is not evenly earned. From 2016 to 2019 the book was essentially flat against the benchmark (+0.39% a year) and selection was negative (-2.66%). The result is carried by 2020-2022 (+9.28%) and 2023-2026 (+5.91%).
The 2024 run. The year-by-year record is the most honest table in the post:
| Year | Portfolio | Benchmark | Active | Allocation | Selection | Interaction | Cost |
|---|---|---|---|---|---|---|---|
| 2014* | -7.34% | -6.58% | -0.76% | -0.84% | +0.69% | +0.02% | -0.63% |
| 2015 | -2.36% | -7.20% | +4.84% | +5.18% | +2.83% | -1.77% | -1.38% |
| 2016 | +16.22% | +28.30% | -12.08% | -0.03% | -8.60% | -1.84% | -1.60% |
| 2017 | +19.97% | +9.52% | +10.45% | +17.02% | -2.47% | -1.93% | -2.18% |
| 2018 | -8.39% | -8.37% | -0.02% | +0.76% | +0.12% | +1.25% | -2.15% |
| 2019 | +8.53% | +6.14% | +2.40% | +4.80% | -1.41% | +0.84% | -1.83% |
| 2020 | -0.73% | -6.73% | +6.00% | +8.36% | +3.99% | -4.27% | -2.07% |
| 2021 | +33.85% | +17.62% | +16.23% | +13.98% | +7.11% | -2.30% | -2.57% |
| 2022 | -11.53% | -18.71% | +7.18% | +2.73% | +14.96% | -8.74% | -1.77% |
| 2023 | +5.47% | +9.97% | -4.50% | +0.25% | -3.41% | +0.66% | -2.00% |
| 2024 | +56.12% | +18.64% | +37.48% | +16.99% | +31.91% | -8.71% | -2.72% |
| 2025 | +34.36% | +28.52% | +5.84% | +4.43% | -4.12% | +7.84% | -2.32% |
| 2026** | -7.29% | +1.40% | -8.69% | -2.37% | -2.31% | -2.55% | -1.47% |
*Two months (November-December 2014). **Nine months to September 2026. Yearly effects are Carino-linked within the year, so they sum to that year’s active return.
2024 contributes +37.5 points of active return in a single year. Excluding it, the full-sample excess CAGR falls from 4.69% to 2.37%, the information ratio from 0.63 to 0.36, and the portfolio CAGR from 9.73% to 6.24%. Excluding both 2024 and 2025, the excess is 2.09% and the IR 0.33. The 2015-2023 window still earns +3.47% a year with an IR of 0.53, so the strategy is not purely a 2024 artifact — but the 2024 run is a large share of the headline, and pretending otherwise would be a selection bias in the write-up.
The top contributors tell the same concentrated story. MNG contributes +21.7% cumulatively, HPS +14.9%, ADI +11.7%, MSA +11.0%, JET +10.8%, ADH +10.3%, SID +8.7% and CSR +7.8%. The largest detractors are CMT (-8.2%), SBM (-3.9%), AKT (-2.2%), SNA (-1.8%) and the banks BCI, CIH, BOA (each around -1 to -1.5%). A handful of mining, real-estate, tech and industrial names did the heavy lifting.
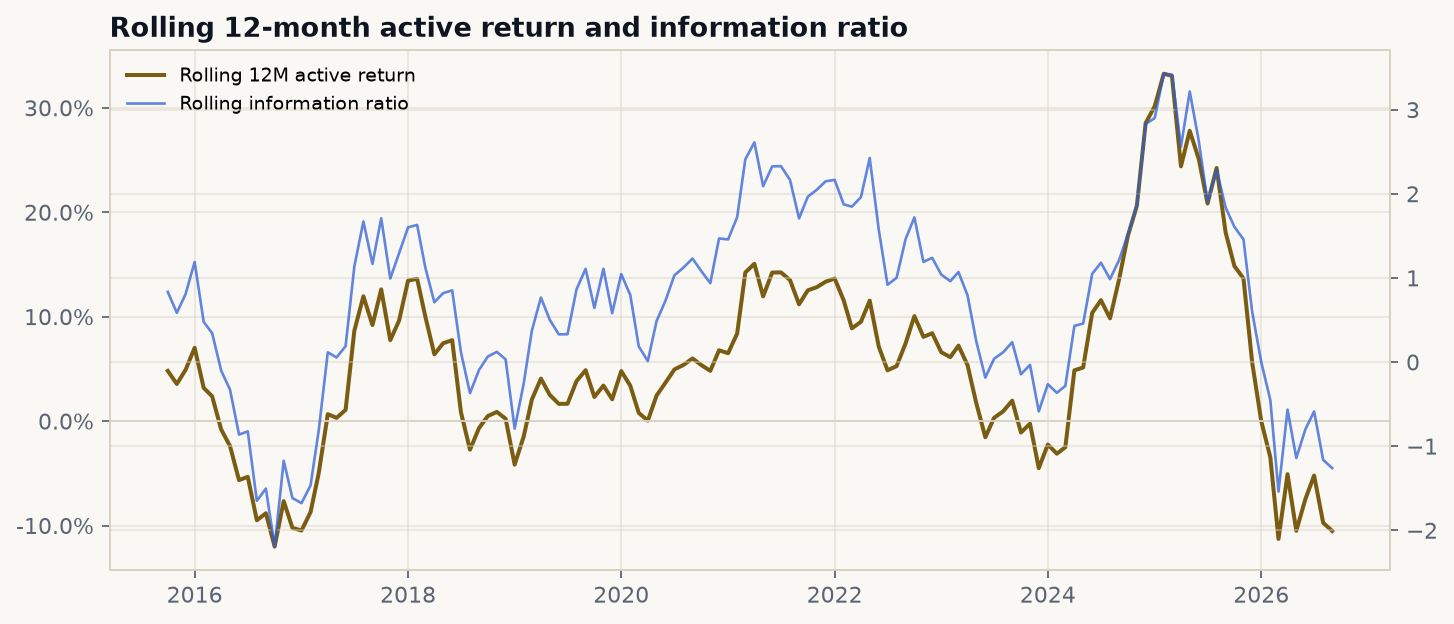
The rolling information ratio is positive for most of the post-2019 period but spends long stretches near zero or below. This is an active bet with a wide range of outcomes, not a steady alpha stream.
Limitations
- The benchmark is constructed. True historical MASI constituent weights and sector weights are not in the data. The Brinson benchmark is a cap-weighted BVC universe built from price-implied market caps. Its 5.04% CAGR is close to the MASI’s 4.62%, but it is not the official index.
- Current shares and current sectors. Market caps use today’s share count applied to historical prices; sector labels are the 2026 classifications. Splits, issuance and reclassifications are not adjusted.
- Survivorship bias. The cache is built from a current screen; names that left the BVC earlier are missing.
- Price returns only. Dividends are excluded from the portfolio and both benchmarks. A total-return version would change the levels, though probably not the allocation/selection split.
- No point-in-time fundamentals. Quality and value are price-based proxies. The quality sleeve is return consistency, not ROE. A negative result on the value proxy is not evidence that fundamental value fails in Casablanca.
- Monthly month-end execution. The book trades at month-end closes. BVC liquidity, price limits and brokerage minimums would make the real implementation worse.
- No market impact or taxes. Costs are a flat 50 bp one-way plus a 0-150 bp sensitivity. There is no square-root impact model, no borrow cost (the book is long-only), and no tax.
- Returns-based factor attribution. The regression attributes covariance, not causality. A factor beta of 0.28 to momentum means the book behaved like a momentum portfolio, not that momentum “caused” the return in a structural sense.
- Multiple specifications. One primary book, but many robustness cuts. The 10-name momentum result is the best of them; it should not be read as the expected result.
- Concentration. 2024 supplies a large share of the excess. The full-sample IR of 0.63 overstates the repeatability of the result; the ex-2024 IR of 0.36 is the more conservative read.
Move the attribution yourself
Scroll to load the interactive attribution lab.
The widget opens on the exact balanced backtest. Switch the style to see how momentum, quality, low-vol, value and size change the attribution; change the number of names, the one-way cost and the benchmark. The preset mode uses the engine’s full backtest. Moving a sleeve slider switches to a blended approximation: the JavaScript blends precomputed sleeve return streams and applies the cost to the stored turnover. It does not rerun the cross-sectional selection, the sector cap or the name cap.
The widget aligns every style to the common November 2014 – September 2026 window. The static tables above use each style’s full available history, so the momentum preset in the widget starts later and differs slightly from the momentum line in the robustness table.
Three disclosures:
- Preset ≠ custom. The presets are the exact Python results at 10, 15 or 20 names. The custom blend is a linear combination of single-factor sleeve portfolios and will not reproduce the composite score exactly.
- Costs change the net return, not the holdings. The turnover series is precomputed. A different cost assumption re-prices the same trades; it does not change the portfolio.
- The benchmark toggle changes the comparison, not the book. BVC-CW is the constructed cap-weighted universe used in the Brinson tables; MASI is the official price index.
Résumé français
La question. Un tableau de performance répond à « le portefeuille a-t-il battu l’indice ? ». L’attribution répond à une question plus difficile : quelles décisions ont produit l’excès ? Pour un livre long-only actions, le rendement actif se décompose en allocation sectorielle, sélection de titres et interaction, auxquelles s’ajoutent les coûts.
Le livre. Un portefeuille BVC règles-based de 15 lignes, équipondéré, reconstruit chaque fin de mois. L’univers exclut les 30 % de plus petites capitalisations. Le score combine trois signaux de prix : momentum 12-1, qualité (régularité des rendements sur 36 mois) et faible volatilité (126 jours). Contraintes : 30 % maximum par secteur, 10 % par ligne. Coûts : 50 pb aller. Indice : univers BVC pondéré par capitalisation, avec le MASI en référence.
Les données. 76 historiques de prix de la BVC du 26 mars 2012 au 14 octobre 2026 ; 74 valeurs dans l’écran courant ; deux valeurs du cache (DRI, EQD) ne sont plus cotées. Le panel mensuel couvre mars 2012 – septembre 2026, mais le portefeuille ne commence qu’en novembre 2014 (143 mois), car les signaux lents ont besoin d’historique. L’univers hors microcaps compte 39 valeurs en médiane. La part de jours à rendement nul est de 14,3 % ; la staleness médiane est de 0 jour. Il n’y a pas de fondamentaux point-in-time : la qualité est une régularité de rendement, pas un ROE. La capitalisation est reconstruite avec le nombre d’actions courant ; les secteurs sont les classifications 2026 ; les dividendes sont exclus ; le biais de survie demeure.
Le résultat. Le livre compose à 9,73 % net contre 5,04 % pour l’indice construit (4,69 % d’excès annuel), avec 15,63 % de volatilité, un Sharpe de 0,67, un drawdown maximal de -28,71 % (indice : -28,87 %), un tracking error de 7,48 % et un ratio d’information de 0,63. Le MASI rapporte 4,62 % ; l’excès contre le MASI est de 5,11 %. Le bêta au benchmark est de 1,01 : ce n’est pas un portefeuille neutre au marché.
L’attribution. En moyenne annualisée : allocation +5,29 %, sélection +3,00 %, interaction -1,70 %, coûts -1,92 %, soit +4,68 % d’excès moyen. En cumulé chaîné par Carino : allocation +144,5 %, sélection +83,6 %, interaction -51,6 %, coûts -53,8 %, total +122,8 % (le rendement actif arithmétique cumulé, pas un taux annuel). L’allocation domine : le plafond sectoriel de 30 % force le livre à sous-pondérer la Finance (environ 43 % de l’indice) et à se diversifier vers des secteurs plus petits. La sélection Finance (+3,51 % par an) est le plus gros poste, mais elle recouvre surtout un biais momentum/size : les lignes Finance du portefeuille sont des promoteurs immobiliers (ADI, ADH), tandis que l’indice est dominé par les banques (BCI, CIH, BOA).
Les facteurs. La régression Newey-West sur 138 mois (avril 2015 – septembre 2026) donne : momentum 0,28 (t = 4,15, contribution +3,57 % par an), size 0,43 (t = 4,87, +0,57 %), low-vol -0,11 (t = -1,23, +0,32 %), value -0,09 (t = -0,76, +0,28 %), quality 0,08 (t = 0,72, +0,18 %). L’alpha résiduel est de +0,09 % (t = 0,05), avec un R² de 0,47. Les facteurs expliquent 4,93 des 5,02 points de rendement actif moyen : il n’y a pas d’alpha de sélection statistiquement significatif. L’allocation sectorielle et les biais de facteurs sont deux descriptions du même pari systématique.
Les coûts. Le turnover est de 3,8x par an ; à 50 pb, les coûts coûtent 1,92 % par an, soit environ 41 % de l’excès brut. À 0 pb l’excès est de +6,81 % ; à 25 pb +5,75 % ; à 50 pb +4,69 % ; à 75 pb +3,65 % ; à 100 pb +2,61 % ; à 150 pb +0,57 %. La sensibilité est forte : la stratégie est investissable à des coûts institutionnels marocains, pas à un coût qui ignore la liquidité de la BVC.
La robustesse. Par style (excès annuel, 15 lignes, 50 pb) : momentum +7,52 %, balanced +4,69 %, quality +2,05 %, size +1,68 %, low-vol -1,53 %, value -1,87 %. Par nombre de lignes : le balanced à 10 lignes rapporte +6,88 % d’excès (IR 0,73), à 20 lignes +2,78 % (IR 0,41). Le momentum à 10 lignes rapporte +11,61 % (IR 0,85). Le plafond sectoriel coûte un peu de rendement mais réduit le risque. Par sous-période : +0,39 % en 2016-2019, +9,28 % en 2020-2022, +5,91 % en 2023-2026. 2024 pèse +37,48 % d’actif à elle seule ; hors 2024, l’excès tombe à 2,37 % et l’IR à 0,36. La fenêtre 2015-2023 reste positive (+3,47 %, IR 0,53), mais le résultat n’est pas également réparti.
Les limites. Indice construit (pas les poids officiels du MASI) ; actions et secteurs courants ; biais de survie ; rendements de prix sans dividendes ; pas de fondamentaux point-in-time ; exécution idéalisée en fin de mois ; pas d’impact de marché ni de fiscalité ; attribution factorielle par régression (covariance, pas causalité) ; plusieurs spécifications testées ; concentration sur 2024. Le résultat principal est un excès systématique de secteur et de facteurs, pas une preuve de stock-picking, avec une répétabilité plus faible que le chiffre de 0,63 ne le suggère.
Reproducibility
cd attribution-lab
python3 -m venv .venv
source .venv/bin/activate
pip install -r requirements.txt   # numpy, pandas, matplotlib

python3 attribution_lab.py selftest
python3 attribution_lab.py analyze
python3 -m unittest discover -s tests -v
Data: Bourse de Casablanca / TradingView CSEMA daily closes and current screen, value date 16 October 2026; MASI daily closes, 26 March 2012 to 14 October 2026. The data payload behind the interactive exhibits is published at /data/attribution-lab.json; the methodology and tests are documented in this case study.
Not investment advice. This is an independent research exercise on public data, not a recommendation on any security. The attribution is an ex-post decomposition of a rules-based backtest, not a forecast of manager skill. Value and quality are price-based proxies, not point-in-time fundamental factors.
