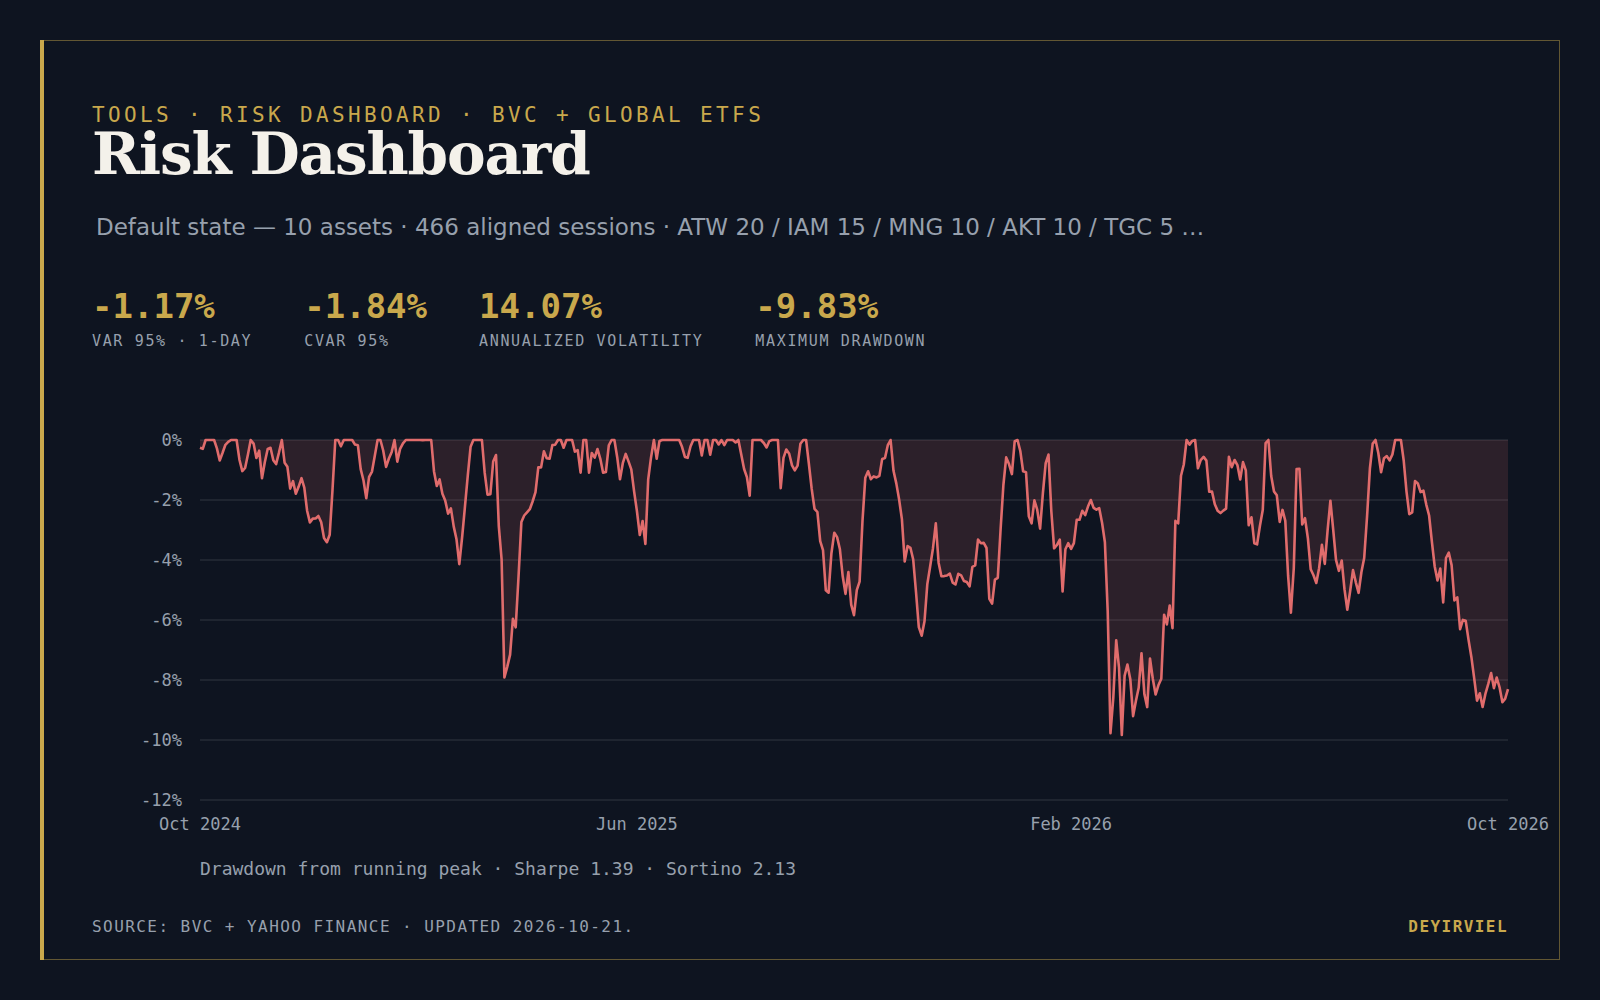
Risk Dashboard
A weighted BVC and global-ETF portfolio risk dashboard: historical VaR 95%/99% and CVaR, annualized volatility, maximum drawdown, Sharpe and Sortino, rolling volatility and correlations, and deterministic equity and rate shocks.
A weighted BVC and global-ETF portfolio risk dashboard: historical VaR 95%/99% and CVaR, annualized volatility, maximum drawdown, Sharpe and Sortino, rolling volatility and correlations, and deterministic equity and rate shocks.
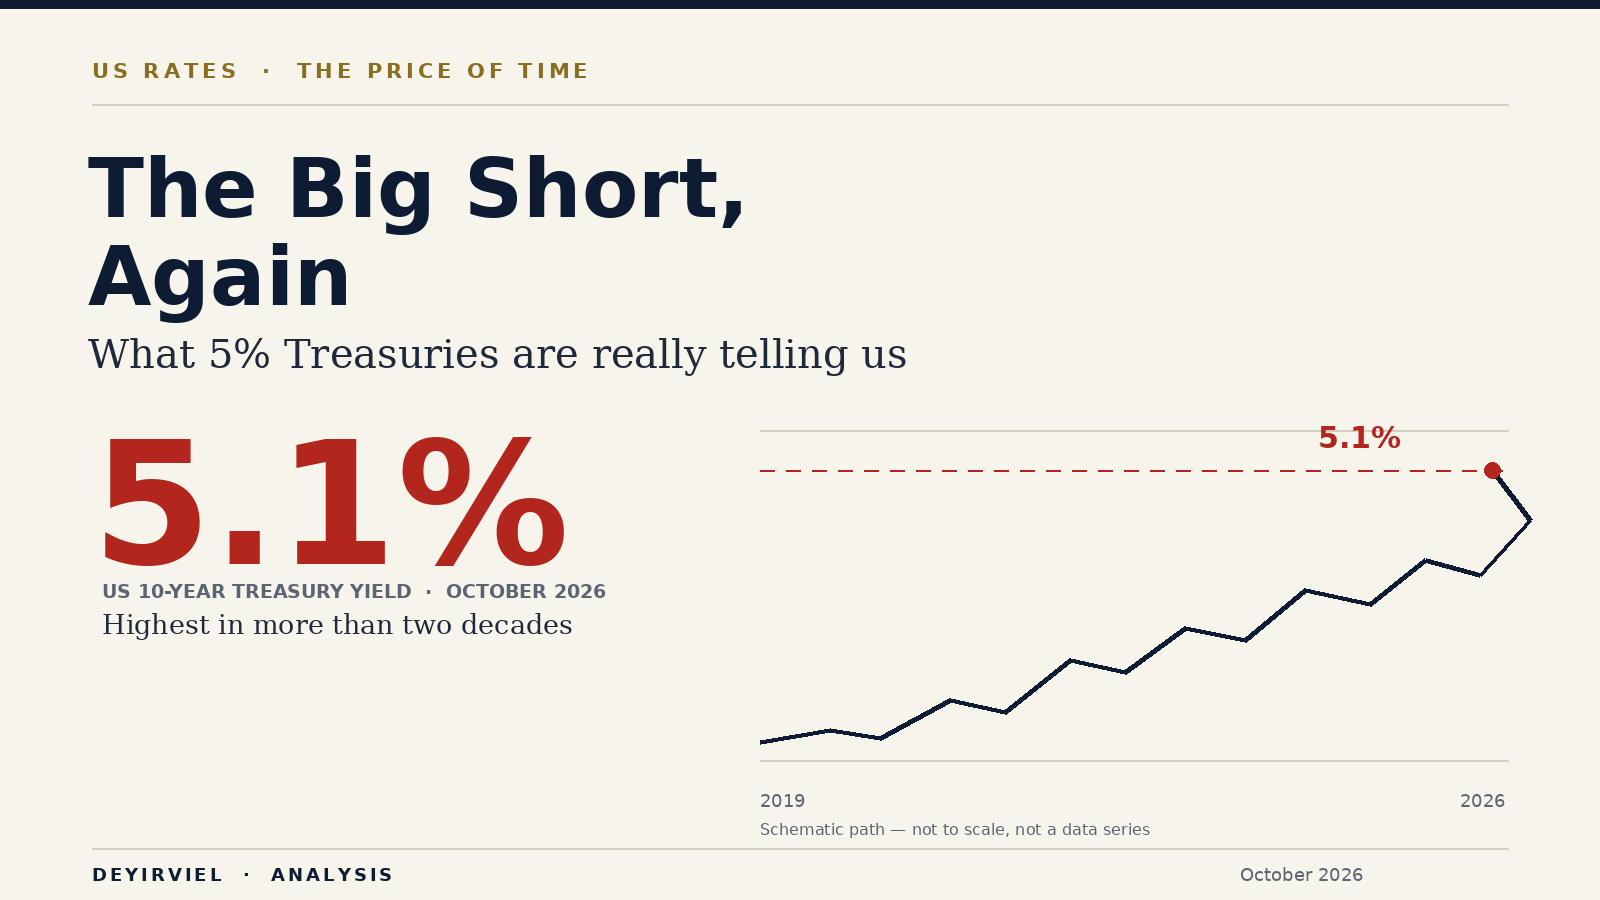
The 10-year Treasury above 5% is not 2008. It is the opposite kind of shock: not a credit crisis but a duration crisis, arriving in a world where the leverage has moved from the banks to private credit, the basis trade and the government itself. A field guide to what rhymes, what doesn’t, and why the real Big Short was never a prediction — it was a financing structure.
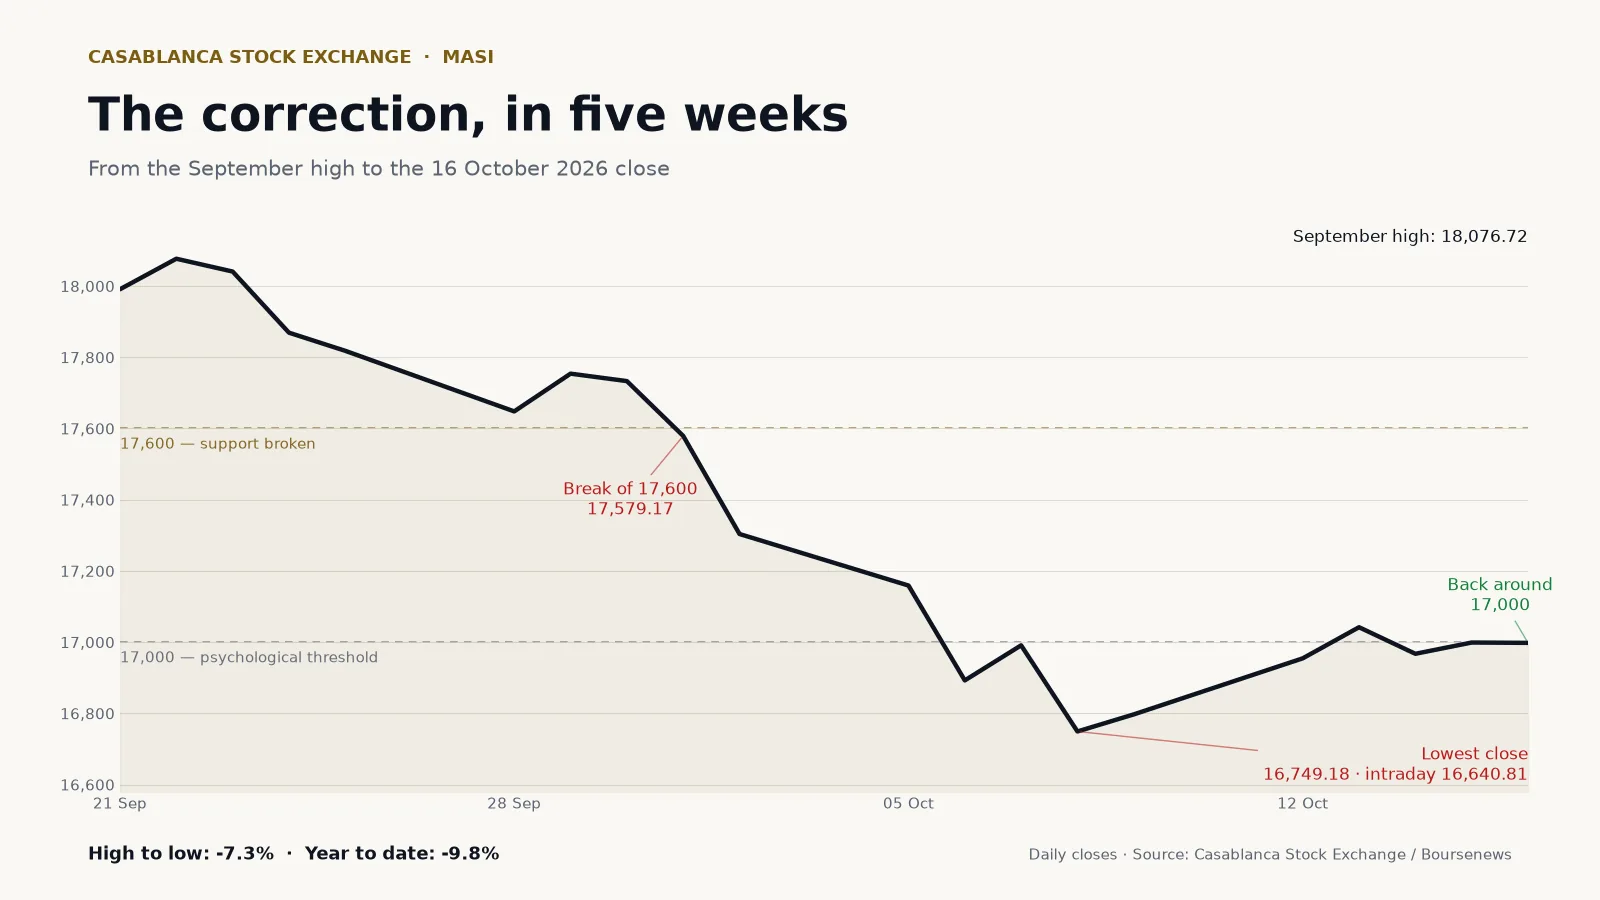
The MASI lost 7.3% between its September high and its 8 October low, and nearly 10% year to date. This is not a crash: it is a correction that exposes the structure of a market that climbed on one leg — mining — with less and less liquidity, while the global cost of capital was changing regime. What happened, what it does not say, and what to watch.
Type to search across portfolio work, corporate finance, notes and pitch exercises.