Woke up one day and decided to be a researcher. There is a beautiful French term for that: sauter du coq à l’âne. Now that I’ve said it, it’s maybe not that beautiful after all. Anyway, this is not a rhetorical note. This is a “why” note. Why a paper on SSRN? What’s the purpose, and what business does a master’s student have publishing about liquidity?
No business at all. Which is probably why it was worth doing.
This was not planned. It wasn’t one of those month-long projects or year-long projects either. This was spontaneous. We had been given this homework in class: build a variance–covariance matrix for a VaR calculation on the MASI. I realized afterwards that the matrix was answering a question I had not asked. It tells you how two stocks move together. It says nothing about whether you can get out of either one. On a market like Casablanca, that second question is not a detail. It is the market.
So I followed it.
The homework that refused to stay homework
One question became another. If liquidity is the missing variable, how do you measure it with daily data? Volume, turnover, zero-return days, Amihud, Roll, Corwin–Schultz, a Liu-style measure, days to exit. Then: is illiquidity just size in disguise? Is it common across stocks, or can you diversify it away? Is the market efficient, or is it just stale? I started with a covariance matrix and ended up with 81 stocks, 737 trading days, from 18 October 2023 to 16 October 2026, and a 22-page paper.
An earlier, shorter version of the audit lives on the site as The BVC Liquidity Lab. The paper is the full version: the diagnostics, the corrections, and the limits stated next to the numbers.
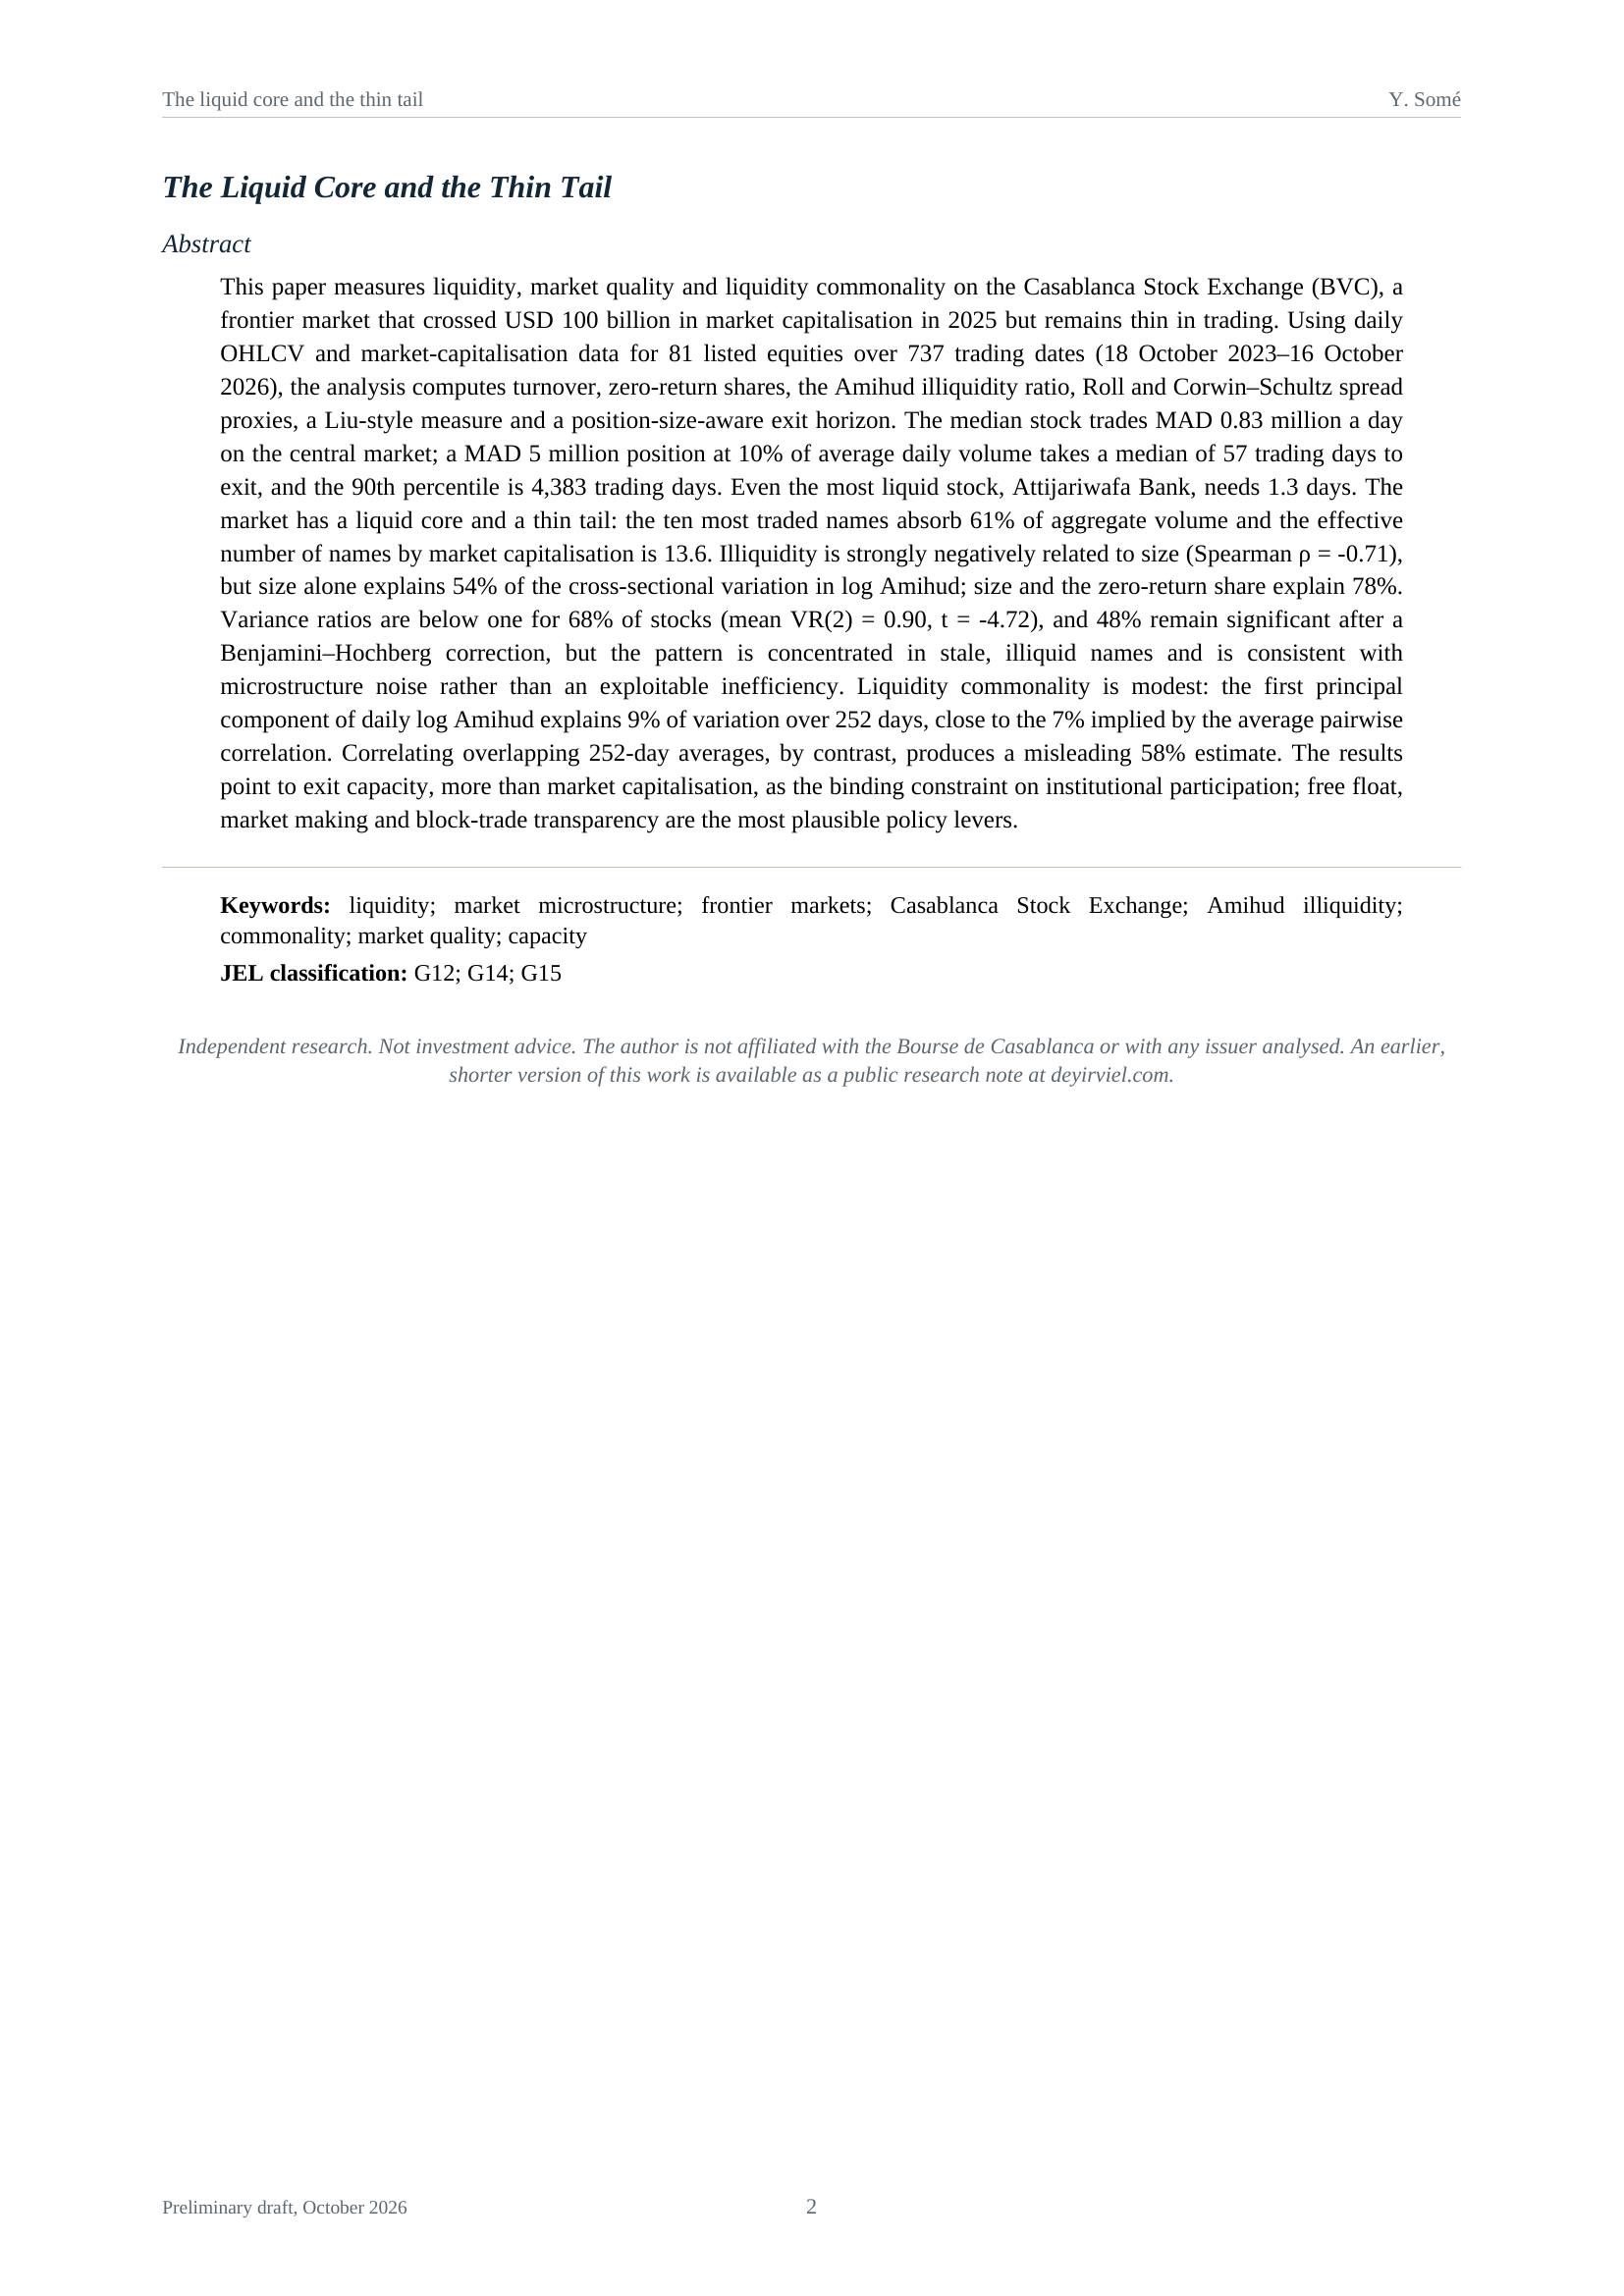
The paper is called The Liquid Core and the Thin Tail. That title is the finding. The median stock trades MAD 0.83 million a day on the central market. A MAD 5 million position at 10% of average daily volume (ADV) takes a median of 57 trading days to exit. At the 90th percentile, the same position takes 4,383 trading days. Even Attijariwafa Bank, the most liquid name on the exchange, needs 1.3 days. The ten most traded names absorb 61% of aggregate volume, and the effective number of names by market capitalisation is 13.6. There is a liquid core, and then there is a long, thin tail where the market is less a market than a waiting room.
And the uncomfortable part is not the tail. It is that size does not save you. Size alone explains 54% of the cross-sectional variation in log Amihud; size plus the zero-return share explains 78%. Liquidity commonality is modest — the first principal component of daily log Amihud explains 9% of variation over 252 days, close to the 7% implied by the average pairwise correlation. The 58% figure in my first draft came from correlating overlapping 252-day averages. I caught it, corrected it, and wrote the correction into the paper. That is the sentence I am proudest of, and it is not even a result. It is a repair.
So why SSRN?
Three reasons, and none of them is a CV line.
The first is a timestamp. A paper in a folder is a promise. A paper on SSRN is a date. It says: this is what I believed on 23 October 2026, with this data, these assumptions, these limits. If I am wrong later, the record shows where. That is not vanity. It is the minimum price of calling something research.
The second is a door. I do not have a research desk, a Bloomberg terminal, or a room full of people paid to tell me I am wrong. What I have is a public dataset, a lot of time, and the internet. SSRN puts the work where a stranger can find it — a student in Rabat, an analyst in Lagos, someone at the Bourse who knows the data better than I do. Maybe one of them will tell me what I missed. That is worth more than the PDF.
The third is the discomfort. It is very easy to keep a paper at 95%: almost finished, almost clean, almost ready. Publishing is what makes it 100% — and therefore wrong in public. I wanted that. A master’s student should not wait for permission to be rigorous. He should publish, take the hit, and learn.
At the end of those beautiful days of hard work and absolute commitment, I am exhausted! But what a beautiful exhaustion! What a sweet headache! I learned a lot about the MASI, about statistics, and about how much I still don’t know. Sauter du coq à l’âne isn’t that crazy after all. The worst that can happen is just a sweet headache.
Twenty-two pages, eight tables, five figures, and an appendix with all 81 names. Start with the abstract. Then read the limitations. Then tell me what I got wrong.