Table of Contents
- What this dashboard answers
- Data and provenance
- Liquidity versus size
- Market-wide liquidity over time
- Liquidity-risk flags
- Efficiency and short-horizon predictability
- Liquidity commonality
- Liquidity league table — top 30
- Methodology and limitations
- Data inputs
- Non-trading days and flags
- Turnover
- Zero-return days
- Amihud illiquidity
- Roll spread
- Corwin-Schultz high-low spread
- Liu-style liquidity measure
- Days to exit
- Variance ratio
- Autocorrelation, Ljung-Box and ARCH
- Liquidity commonality
- Event studies — not computed
- Reproducibility
- References
- What the data supports
- What the data cannot support
- Interpretation warning
- Data exports
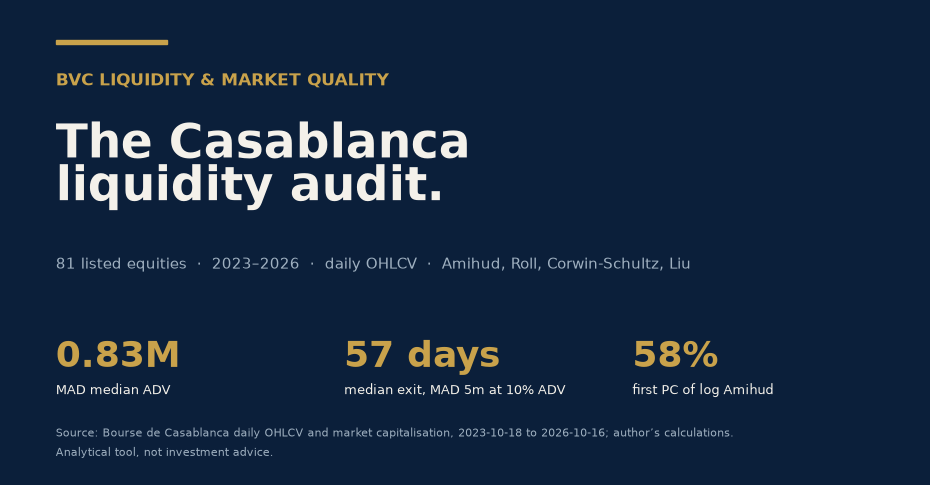
In one paragraph. The Casablanca Stock Exchange is not one market; it is a liquid core and a long, thin tail. Using 81 listed equities and 737 trading dates from 2023-10-18 to 2026-10-16, I measure liquidity stock by stock and over time. Median ADV is 0.83M MAD; a MAD 5m position at 10% of ADV takes a median 57 days to exit, and even ATW needs 1.3 days. 84% of stocks are red-flagged, 12% amber, 4% have no usable ADV. Efficiency is noisy: 68% of stocks have a variance ratio below one, 48% significantly so at the 5% level; 87% show ARCH effects and 63% reject no autocorrelation. Liquidity is not idiosyncratic: the first principal component of log Amihud explains 58% of variation over 252 days. Daily data cannot measure true bid-ask spreads; Roll and Corwin-Schultz are proxies, and the page says so.
Résumé (français). La Bourse de Casablanca n’est pas un marché unique : c’est un noyau liquide et une longue queue fine. Sur 81 valeurs et 737 séances du 18 octobre 2023 au 16 octobre 2026, je mesure la liquidité titre par titre et dans le temps. L’ADV médian est de 0,83 M MAD ; une position de 5 M MAD à 10 % de l’ADV met en médiane 57 jours à sortir, et même ATW demande 1,3 jour. 84 % des valeurs sont en alerte rouge, 12 % en orange, 4 % sans ADV exploitable. L’efficience est bruitée : 68 % des titres ont un ratio de variance inférieur à un, 48 % de façon significative à 5 % ; 87 % présentent des effets ARCH et 63 % rejettent l’absence d’autocorrélation. La liquidité est commune : la première composante principale du log Amihud explique 58 % de la variation à 252 jours. Les données quotidiennes ne permettent pas de mesurer le vrai spread bid-ask ; Roll et Corwin-Schultz sont des proxys, et la page le dit.
What this dashboard answers
How liquid is the Casablanca Stock Exchange, stock by stock and over time? The dashboard uses daily OHLCV and market capitalisation from the Bourse de Casablanca for 81 listed equities over 2023-10-18 to 2026-10-16. It separates genuine liquidity from size: a large market capitalisation does not guarantee a deep order book.
Headline facts (latest 252-day window, as of 2026-10-16):
- Median market capitalisation: MAD 3.8bn; median ADV: MAD 0.8m.
- Median days to exit a MAD 5m position at 10% of ADV: 57.1 days.
- Liquidity-risk flags: 0% green, 12% amber, 84% red, 4% no ADV.
- 68% of stocks have a variance ratio below one; 48% are significantly below one at the 5% level.
- Volatility clustering is widespread: 87% reject no ARCH at 5%; 63% reject no autocorrelation at 5%.
- Liquidity commonality is material: the first principal component explains 58% of log-Amihud variation over 252 days.
Even the most liquid stock in the sample, ATW, requires 1.3 days to exit a MAD 5m position at 10% of ADV. The BVC is a thin market: size alone does not buy liquidity.
Data and provenance
- Issuer list and shares outstanding: Bourse de Casablanca — Liste des émetteurs.
- MASI composition: Bourse de Casablanca — MASI index detail. Current membership only.
- Daily OHLCV and market capitalisation: Bourse de Casablanca — stock historical API (
/api/boursenova/stock-historical). Raw and adjusted series cached underdata/raw/bvc/. - Provenance: source URLs, retrieval timestamps and SHA256 hashes are stored in
data/processed/bvc_liquidity.sqlite(sourcestable). Retrieval date: 2026-10-18. The full register is also available as sources.csv, and the free-float status as free_float_status.csv.
Liquidity versus size
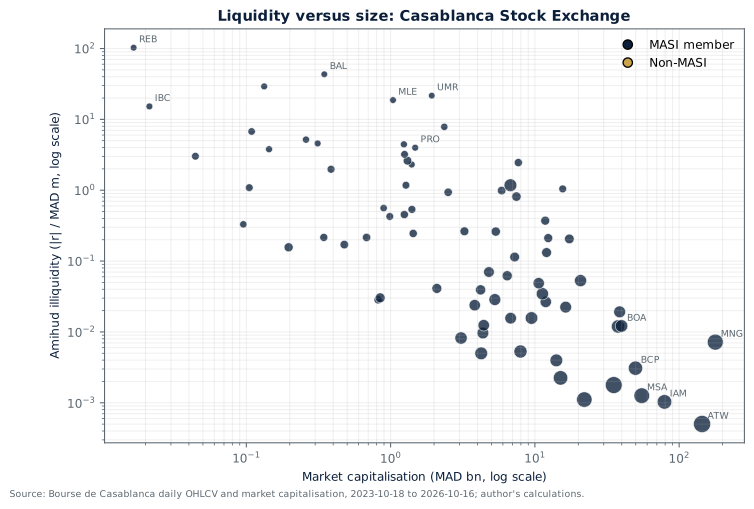
The vertical axis is Amihud illiquidity. Higher values mean a larger price move per MAD of trading volume. Several large-cap names sit in the more liquid region, but the relationship is not monotonic: free-float, ownership concentration and trading habits matter.
Market-wide liquidity over time
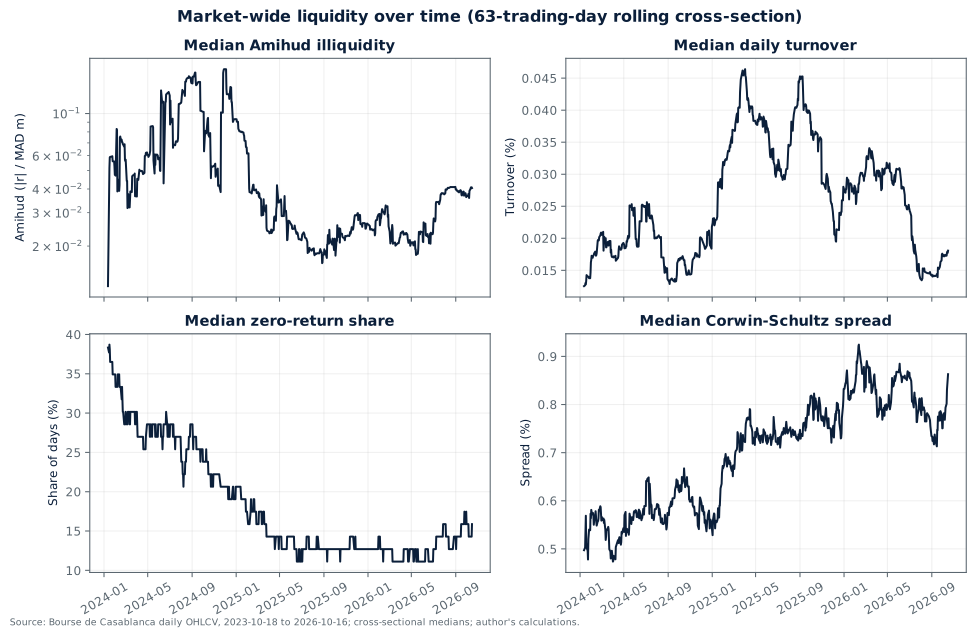
The time series shows cross-sectional medians of 63-trading-day rolling metrics. The 2023–2026 window includes episodes of thin trading and wide daily spread proxies.
Liquidity-risk flags
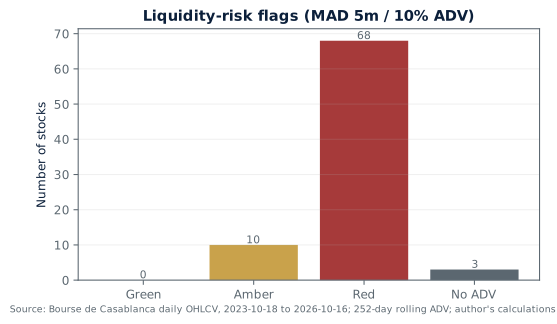
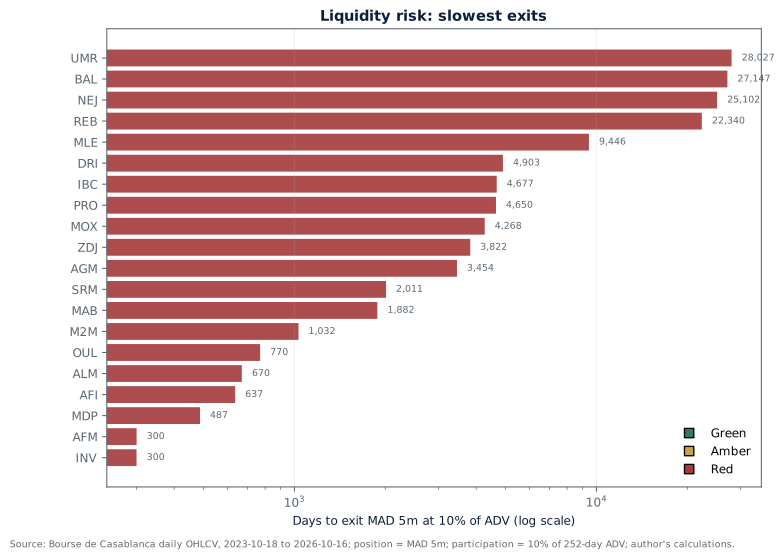
The exit metric is deliberately simple: MAD 5m / (10% × 252-day ADV). It is a liquidity-risk flag, not an execution schedule. A stock with a high days-to-exit figure may still trade in blocks or via negotiated deals that are not visible in daily data.
Efficiency and short-horizon predictability
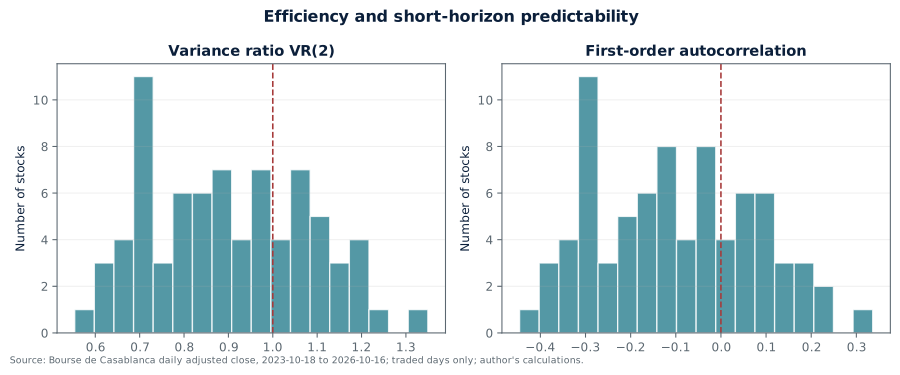
Variance ratios below one and negative first-order autocorrelation are widespread. This is consistent with bid-ask bounce, stale prices, limit constraints and thin trading. It is not proof of exploitable inefficiency: daily data cannot separate microstructure noise from fundamental mean reversion.
Liquidity commonality
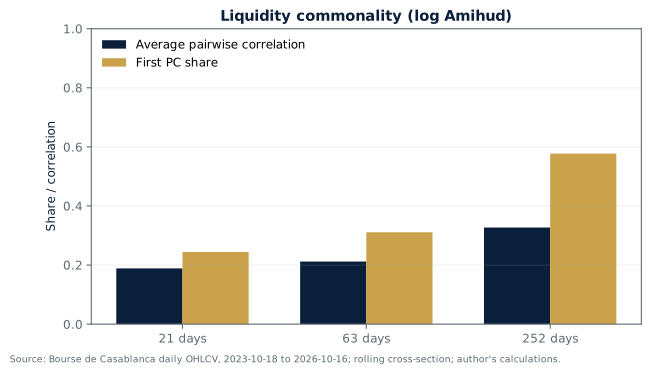
Liquidity co-moves across stocks. The 252-day first principal component of log Amihud explains a large share of cross-sectional variation, which matters for portfolio liquidity risk: a market-wide stress can dry up liquidity across many names at once.
Liquidity league table — top 30
| Rank | Ticker | Issuer | Sector | MASI | Mkt cap (MAD bn) | ADV (MAD m) | Turnover (%) | Amihud | Zero-ret (%) | CS spread (%) | Days to exit | Flag |
|---|---|---|---|---|---|---|---|---|---|---|---|---|
| 1 | ATW | ATTIJARIWAFA BANK | Banques | Yes | 144.14 | 38.39 | 0.025 | 0.001 | 8.7 | 0.46 | 1.3 | Amber |
| 2 | IAM | ITISSALAT AL-MAGHRIB | Télécommunications | Yes | 79.12 | 17.34 | 0.019 | 0.001 | 6 | 0.36 | 2.9 | Amber |
| 3 | TGC | TRAVAUX GENERAUX DE CONSTRUCTION DE CASABLANCA | Bâtiment et Matériaux de Construction | Yes | 22.01 | 23.79 | 0.084 | 0.001 | 8.3 | 0.5 | 2.1 | Amber |
| 4 | MSA | SOCIETE D’EXPLOITATION DES PORTS - MARSA MAROC | Services de transport | Yes | 55.05 | 25.04 | 0.039 | 0.001 | 6.7 | 0.55 | 2 | Amber |
| 5 | GTM | SOCIETE GENERALE DES TRAVAUX DU MAROC | Bâtiment et Matériaux de Construction | Yes | 35.22 | 35.9 | 0.074 | 0.002 | 22.6 | 0.56 | 1.4 | Amber |
| 6 | AKT | AKDITAL | Santé | Yes | 15.07 | 16.94 | 0.1 | 0.002 | 6 | 0.52 | 3 | Amber |
| 7 | BCP | BANQUE CENTRALE POPULAIRE | Banques | Yes | 49.81 | 15.9 | 0.029 | 0.003 | 17.5 | 0.96 | 3.1 | Amber |
| 8 | ADH | DOUJA PROMOTION GROUPE ADDOHA SA | Participation et promotion immobilières | Yes | 14.09 | 8.59 | 0.063 | 0.004 | 2.8 | 0.71 | 5.8 | Red |
| 9 | RDS | RESIDENCES DAR SAADA | Participation et promotion immobilières | Yes | 4.25 | 8.77 | 0.202 | 0.005 | 4.4 | 0.76 | 5.7 | Red |
| 10 | ADI | ALLIANCES DEVELOPPEMENT IMMOBILIER SA | Participation et promotion immobilières | Yes | 7.95 | 10.12 | 0.095 | 0.005 | 6.3 | 0.8 | 4.9 | Amber |
| 11 | MNG | MANAGEM | Mines | Yes | 178.09 | 27.62 | 0.02 | 0.007 | 8.3 | 0.8 | 1.8 | Amber |
| 12 | VCN | VICENNE | Santé | Yes | 3.08 | 7.26 | 0.162 | 0.008 | 7.5 | 0.64 | 6.9 | Red |
| 13 | JET | JET CONTRACTORS | Bâtiment et Matériaux de Construction | Yes | 4.36 | 5.45 | 0.075 | 0.01 | 5.2 | 1.07 | 9.2 | Red |
| 14 | LHM | Holcim Maroc S.A | Bâtiment et Matériaux de Construction | Yes | 37.7 | 11.17 | 0.027 | 0.012 | 8.7 | 0.95 | 4.5 | Amber |
| 15 | BOA | BANK OF AFRICA | Banques | Yes | 39.87 | 8.03 | 0.017 | 0.012 | 9.1 | 1.03 | 6.2 | Red |
| 16 | CMG | CMGP GROUP | Industrie Agricole | Yes | 4.42 | 4.81 | 0.078 | 0.012 | 8.3 | 0.93 | 10.4 | Red |
| 17 | CFG | CFG BANK | Banques | Yes | 6.79 | 5.14 | 0.068 | 0.016 | 16.3 | 1.18 | 9.7 | Red |
| 18 | SMI | SOCIETE METALLURGIQUE D’IMITER | Mines | Yes | 9.48 | 8.05 | 0.077 | 0.016 | 3.6 | 0.8 | 6.2 | Red |
| 19 | TQM | TAQA MOROCCO | Electricité | Yes | 38.69 | 5.78 | 0.012 | 0.019 | 13.5 | 0.99 | 8.6 | Red |
| 20 | CSR | COSUMAR | Agroalimentaire et Production | Yes | 16.35 | 5.49 | 0.03 | 0.022 | 9.9 | 0.87 | 9.1 | Red |
| 21 | HPS | HIGHTECH PAYMENT SYSTEMS | Matériels, Logiciels et Services Informatiques | Yes | 3.83 | 4.61 | 0.109 | 0.024 | 8.7 | 0.72 | 10.8 | Red |
| 22 | CIH | CREDIT IMMOBILIER ET HOTELIER | Banques | Yes | 11.9 | 4.54 | 0.033 | 0.027 | 8.3 | 0.86 | 11 | Red |
| 23 | IMO | IMMORENTE INVEST | Sociétés de placement immobilier | Yes | 0.82 | 0.35 | 0.043 | 0.028 | 17.5 | 0.42 | 142.3 | Red |
| 24 | CAP | CASH PLUS S.A | Sociétés de financement et Autres Activités Financières | Yes | 5.28 | 5.81 | 0.079 | 0.029 | 25.4 | 0.89 | 8.6 | Red |
| 25 | SNA | STOKVIS NORD AFRIQUE | Distributeurs | Yes | 0.85 | 1.82 | 0.109 | 0.03 | 2.4 | 0.82 | 27.5 | Red |
| 26 | LBV | LABEL VIE | Distributeurs | Yes | 11.27 | 7.04 | 0.059 | 0.035 | 18.7 | 0.75 | 7.1 | Red |
| 27 | DHO | DELTA HOLDING | Sociétés de Portefeuilles / Holdings | Yes | 4.2 | 2.22 | 0.038 | 0.039 | 8.7 | 1.1 | 22.5 | Red |
| 28 | MUT | MUTANDIS SCA | Agroalimentaire et Production | Yes | 2.09 | 1.86 | 0.08 | 0.041 | 9.9 | 0.78 | 26.9 | Red |
| 29 | CDM | CREDIT DU MAROC | Banques | Yes | 10.63 | 4.44 | 0.039 | 0.049 | 9.1 | 0.84 | 11.3 | Red |
| 30 | CMA | CIMENTS DU MAROC | Bâtiment et Matériaux de Construction | Yes | 20.73 | 6.7 | 0.027 | 0.053 | 10.7 | 0.73 | 7.5 | Red |
The full 81-stock table is available as CSV. The ranking is by Amihud illiquidity (lower is more liquid). The flag uses the MAD 5m / 10% ADV rule.
Methodology and limitations
The full estimator definitions, formulas, source papers and data caveats are below. The short version: free-float data is not available in structured BVC public data, so free-float-adjusted turnover is not computed; central-market versus block-trade volume is not split; Roll and Corwin-Schultz are daily spread proxies, not quoted bid-ask spreads; limit-hit and halt frequencies are proxies; MASI membership is current, not historical; the sample is a three-year window.
Methodology — estimators, formulas and sources
Methodology — estimators and sources
This page documents every estimator used in the dashboard. The unit of analysis is a listed BVC equity, observed on the union of BVC trading dates. The primary evaluation window is the latest 252 trading days; rolling 21-, 63- and 252-day windows are also computed.
Data inputs
- Prices and volume: Bourse de Casablanca
stock-historicalAPI, daily OHLCV, market capitalisation and transaction count. Raw andisCoursAjuste=trueseries are both downloaded; adjusted close is used for return-based tests, raw OHLC for high-low spread estimators. - Shares outstanding: daily
market_cap / close; current issuer-list shares are used only when the daily market cap is unavailable. - MASI membership: current MASI composition from the BVC index detail page. Historical membership is not available in structured form.
- Free float: not available in structured public BVC data at the retrieval date. Free-float-adjusted turnover is therefore reported as unavailable, not proxied.
- Central market vs block trades: not split in the public API. The dashboard uses total reported volume and flags the limitation.
Non-trading days and flags
The trading calendar is the union of dates on which at least one stock has a BVC quote. For each stock and market date:
has_quote= a BVC row exists.traded=has_quoteand volume > 0.zero_volume= volume <= 0.- Missing dates are forward-filled for close and market cap, volume is set to zero, and returns are set to zero. This preserves zero-return days rather than deleting them.
- Suspension proxy: the first day of a run of at least five consecutive market dates with no BVC quote. This is a proxy, not an official halt flag.
- Limit-hit proxy:
|raw return| >= 9.5%. This is a configurable proxy, not an official exchange limit flag.
Turnover
\[ \text{Turnover}_{i,t} = \frac{\text{Volume in shares}_{i,t}}{\text{Shares outstanding}_{i,t}} \]The dashboard reports the rolling mean daily turnover. Free-float-adjusted turnover would replace total shares with free-float shares; it is not computed because free-float data is unavailable.
Zero-return days
\[ \text{ZeroReturnShare}_{i,w} = \frac{1}{T_w}\sum_{t\in w} \mathbf{1}\{|\text{return}_{i,t}| \le \epsilon\} \]The epsilon is 1e-7. Zero-return days include no-trade days and stale prices. This measure is associated with Lesmond, Ogden and Trzcinka (1999) and is a direct proxy for trading costs in thin markets.
Amihud illiquidity
\[ \text{Amihud}_{i,t} = \frac{|\text{return}_{i,t}|}{\text{MAD volume}_{i,t}/10^6} \]The rolling metric is the mean over days with positive MAD volume. Higher values mean a larger price impact per unit of trading value. Source: Amihud (2002), Journal of Financial Markets.
Roll spread
For a price series \(P_t\), let \(\Delta P_t = P_t - P_{t-1}\) and let \(\widehat{\text{Cov}}\) be the serial covariance of consecutive price changes. The Roll (1984) estimator is:
\[ S_{\text{Roll}} = 2\sqrt{-\widehat{\text{Cov}}(\Delta P_t,\Delta P_{t-1})} \]expressed as a fraction of the mean price. If the covariance is non-negative, the estimator is undefined and is stored as NaN. This is the documented negative-estimate handling. Source: Roll (1984), Journal of Finance.
Corwin-Schultz high-low spread
For consecutive days \(t\) and \(t+1\):
\[ \beta = \left[\ln(H_t/L_t)\right]^2 + \left[\ln(H_{t+1}/L_{t+1})\right]^2 \] \[ \gamma = \left[\ln\left(\frac{\max(H_t,H_{t+1})}{\min(L_t,L_{t+1})}\right)\right]^2 \] \[ \alpha = \frac{\sqrt{2\beta}-\sqrt{\beta}}{3-2\sqrt{2}} - \sqrt{\frac{\gamma}{3-2\sqrt{2}}} \] \[ S_{CS} = \frac{2(e^\alpha-1)}{1+e^\alpha} \]Negative daily estimates are retained in the raw series. For the rolling average, negative estimates are replaced with zero and the share of negative estimates is recorded. Source: Corwin and Schultz (2012), Journal of Finance.
Important: Roll and Corwin-Schultz are daily-data proxies. They are not quoted or effective bid-ask spreads, and they can be biased by stale prices, discreteness, limit hits and non-trading.
Liu-style liquidity measure
\[ L_{i,w} = Z_{i,w} + \frac{1}{T_w}\left(\frac{\overline{\text{Turnover}}_{i,w}}{0.0005}\right) \]where \(Z\) is the number of zero-volume days in the window and \(\overline{\text{Turnover}}\) is average daily turnover. Higher values indicate less liquidity. This is a Liu-style adaptation of the zero-volume/turnover measure in Liu (2006), Journal of Financial Economics; it is not claimed to be an exact reproduction of the published implementation.
Days to exit
\[ \text{DaysToExit}_{i} = \frac{\text{MAD }5{,}000{,}000}{0.10 \times \text{ADV}_{i}} \]where ADV is average daily MAD volume over 252 trading days. Flags:
- Green: ≤ 1 day
- Amber: > 1 and ≤ 5 days
- Red: > 5 days
- No ADV: missing or zero ADV
This is a liquidity-risk flag, not an execution schedule. It ignores block trades, hidden liquidity, intraday volume profiles and price impact.
Variance ratio
The Lo-MacKinlay (1988) variance ratio for horizon \(q\) is:
\[ VR(q) = \frac{\sigma^2(q)}{q\sigma^2(1)} \]where \(\sigma^2(q)\) is the variance of overlapping \(q\)-period returns and \(\sigma^2(1)\) is the one-period variance. The dashboard reports a heteroskedasticity-robust \(z\)-statistic. \(VR(q)=1\) is consistent with a random walk; \(VR(q)<1\) indicates mean reversion or negative serial correlation. The test is run on traded-day adjusted returns to avoid mechanically inducing negative autocorrelation through stale zero returns. Source: Lo and MacKinlay (1988), Review of Financial Studies.
Autocorrelation, Ljung-Box and ARCH
- First-order autocorrelation of daily returns.
- Ljung-Box Q statistic at 10 lags; the reported p-value tests no autocorrelation. Source: Ljung and Box (1978).
- ARCH Lagrange-multiplier test at 5 lags; the reported p-value tests no conditional heteroskedasticity. Source: Engle (1982), Econometrica.
Liquidity commonality
For each rolling window, the dashboard builds a date × stock panel of a liquidity metric (log Amihud by default), computes the pairwise correlation matrix, and reports:
- average pairwise correlation;
- the share of total variance explained by the first principal component.
This follows the liquidity-commonality logic in Chordia, Roll and Subrahmanyam (2000), Journal of Financial Economics. Commonality is a statistical description, not a causal claim.
Event studies — not computed
Liquidity around earnings, dividends and index changes requires a structured event calendar. No normalized, historical event calendar was available from BVC/AMMC in this build. The dashboard therefore does not report event-window liquidity. A generic event-study hook can be added when a dated events.csv (date, symbol, event_type) is supplied.
Reproducibility
- Raw BVC files are cached under
data/raw/bvc/. - Source URLs, retrieval timestamps and SHA256 hashes are stored in the
sourcestable indata/processed/bvc_liquidity.sqlite. - All metrics are recomputed from the cached raw files by the pipeline.
- Tests cover known-answer cases for Amihud, Roll, Corwin-Schultz, Liu, days-to-exit and variance ratios.
References
- Amihud, Y. (2002). Illiquidity and stock returns: cross-section and time-series effects. Journal of Financial Markets, 5(1), 31–56.
- Chordia, T., Roll, R., & Subrahmanyam, A. (2000). Commonality in liquidity. Journal of Financial Economics, 56(1), 3–28.
- Corwin, S. A., & Schultz, P. (2012). A simple way to estimate bid-ask spreads from daily high and low prices. Journal of Finance, 67(2), 719–760.
- Engle, R. F. (1982). Autoregressive conditional heteroscedasticity with estimates of the variance of United Kingdom inflation. Econometrica, 50(4), 987–1007.
- Lesmond, D. A., Ogden, J. P., & Trzcinka, C. A. (1999). A new estimate of transaction costs. Review of Financial Studies, 12(5), 1113–1141.
- Liu, W. (2006). A liquidity-augmented capital asset pricing model. Journal of Financial Economics, 82(3), 631–671.
- Ljung, G. M., & Box, G. E. P. (1978). On a measure of lack of fit in time series models. Biometrika, 65(2), 297–303.
- Lo, A. W., & MacKinlay, A. C. (1988). Stock market prices do not follow random walks: evidence from a simple specification test. Review of Financial Studies, 1(1), 41–66.
- Roll, R. (1984). A simple implicit measure of the effective bid-ask spread in an efficient market. Journal of Finance, 39(4), 1127–1139.
Data limitations — what daily BVC data can and cannot support
Data limitations — what daily BVC data can and cannot support
What the data supports
- Daily OHLCV, volume in shares and MAD, market capitalisation, transaction counts.
- Current shares outstanding and current MASI membership.
- Daily liquidity proxies: turnover, zero-return share, Amihud, Roll, Corwin-Schultz, Liu-style, days-to-exit.
- Daily return-based efficiency tests: variance ratios, autocorrelation, Ljung-Box, ARCH.
- Cross-sectional liquidity commonality.
What the data cannot support
True bid-ask spreads
Daily OHLCV cannot identify quoted or effective bid-ask spreads. Roll (1984) and Corwin-Schultz (2012) are estimators, not measurements. They are sensitive to stale prices, price discreteness, limit hits and non-trading. The dashboard labels them as spread proxies.
Intraday liquidity and order-book depth
No intraday data is available in this build. We cannot measure intraday price impact, order-book depth, time-to-execution, effective spread, realized spread or intraday volatility. The days-to-exit metric is an ADV-based approximation, not an execution model.
Free float
No structured free-float field was exposed by the public BVC pages audited on 2026-10-18. Free-float-adjusted turnover is therefore not computed. Total-share turnover is reported instead. A free-float proxy would be an assumption, not data, and is deliberately avoided.
Central market vs block trades
The public BVC API aggregates reported volume. The daily bulletins contain central-market and block-trade sections, but a clean historical split was not extracted. The dashboard therefore uses total volume and cannot separate lit continuous trading from block/negotiated trades.
Event studies
Earnings, dividend and index-change event dates are not available as a normalized historical calendar. The dashboard does not report liquidity around these events. A generic event-study hook can be added when a dated event file is supplied.
Historical MASI membership
Only the current MASI composition is available in structured form. The dashboard flags current membership. Historical index changes and survivorship are not modeled.
Delisted and suspended stocks
The universe is the current BVC issuer list. Delisted stocks may be absent, creating survivorship bias. Suspended stocks with no BVC rows are detected as no-quote runs, but the reason for suspension is not known.
Sample window
The public BVC API returns a rolling three-year window. The dashboard uses 2023-10-18 to 2026-10-16. It does not cover earlier cycles or structural changes in BVC microstructure.
Limit-hit and halt flags
- Limit-hit proxy:
|raw return| >= 9.5%. This is not an official exchange limit flag. BVC price-limit rules vary by compartment and security; the dashboard does not encode regulatory thresholds. - Halt proxy: a run of at least five consecutive market dates with no BVC quote. This may reflect suspension, delisting, a data gap or a security that simply did not trade.
Adjusted prices
BVC isCoursAjuste=true is used for adjusted close. The exact corporate-action adjustment methodology and dividend treatment are not independently documented in the retrieved data. Price-based liquidity estimators use raw OHLC; return-based efficiency tests use adjusted close. This distinction is documented.
Data source stability
The BVC historical API is undocumented. The scraper caches raw JSON and stores hashes, but endpoint changes or rate limits can break future runs. The BVC TLS chain did not validate with the system CA store on 2026-10-18; TLS verification was disabled for read-only public data collection and is documented as a limitation.
Interpretation warning
A high days-to-exit figure or a wide Roll/CS spread does not by itself mean a stock is mispriced. It means the observable daily market is thin, noisy or constrained. Block trades, strategic ownership, free-float concentration and off-market arrangements can make a stock look less liquid than it is for a large negotiated transaction. Conversely, a large market cap does not guarantee liquidity.
This dashboard is an analytical tool, not investment advice.
Data exports
The data exports behind the tables are available as sources.csv, free_float_status.csv and league_table.csv. The methodology section above documents every estimator and cites its source paper. The pipeline code is not published; the inputs, formulas and filters are stated so the calculations can be reproduced.
Source: Bourse de Casablanca daily OHLCV and market capitalisation, 2023-10-18 to 2026-10-16. Author’s calculations. This is an analytical tool, not investment advice.
