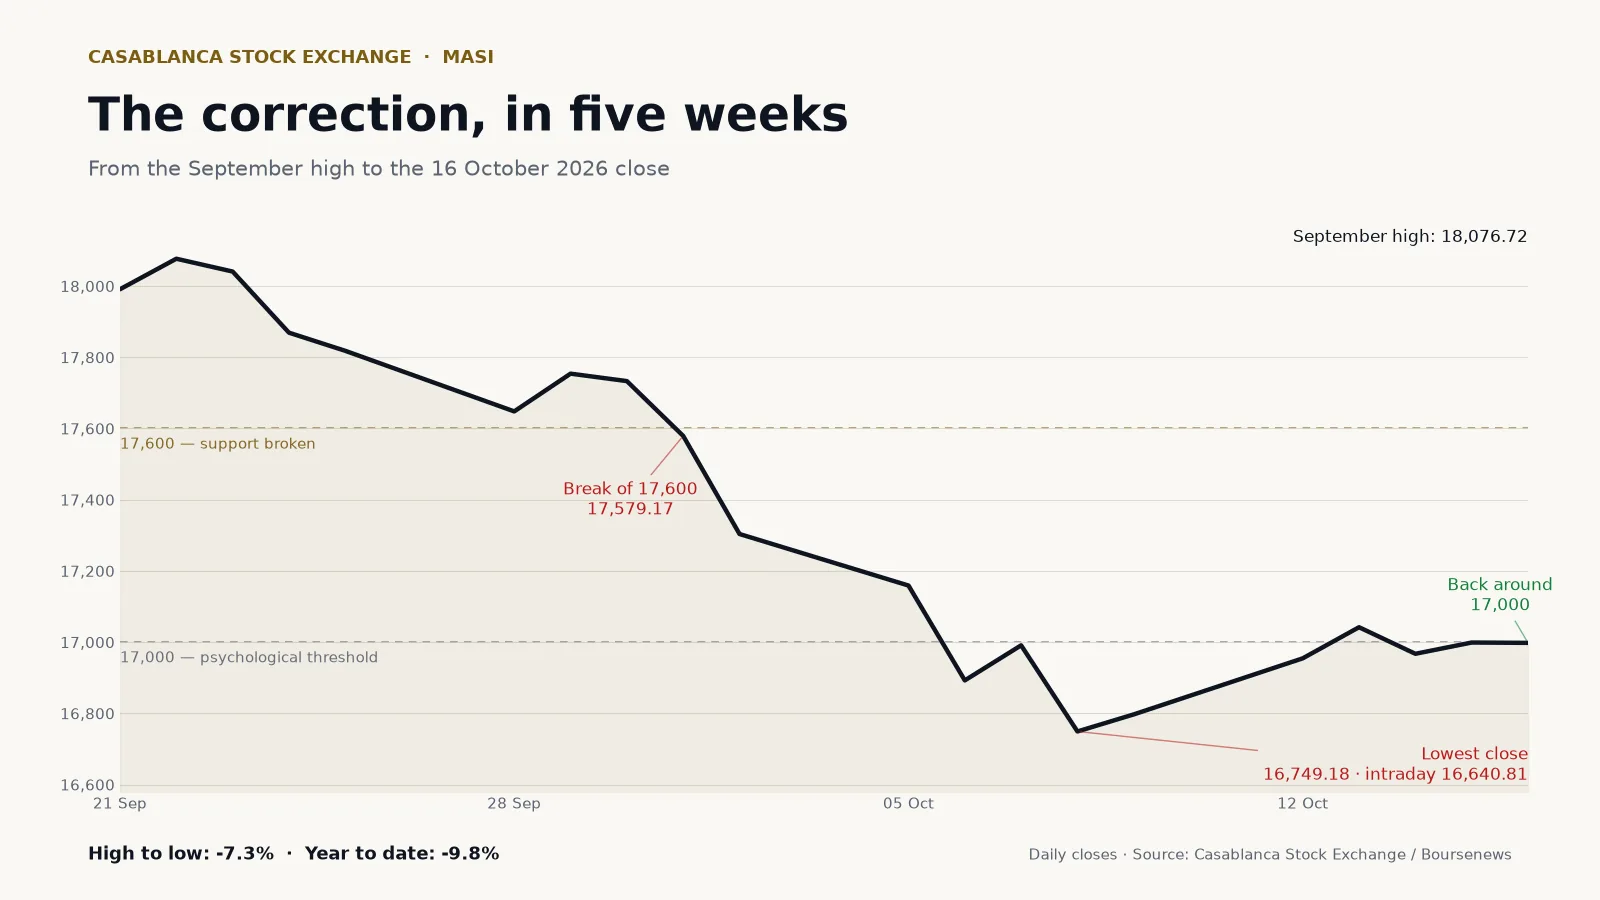
MASI below 17,000: anatomy of a correction that is not a crash
The MASI lost 7.3% between its September high and its 8 October low, and nearly 10% year to date. This is not a crash: it is a correction that exposes the structure of a market that climbed on one leg — mining — with less and less liquidity, while the global cost of capital was changing regime. What happened, what it does not say, and what to watch.