This is a hypothetical allocation exercise, not financial planning, tax, or investment advice. The household is illustrative; the assumptions and limitations are part of the case study.
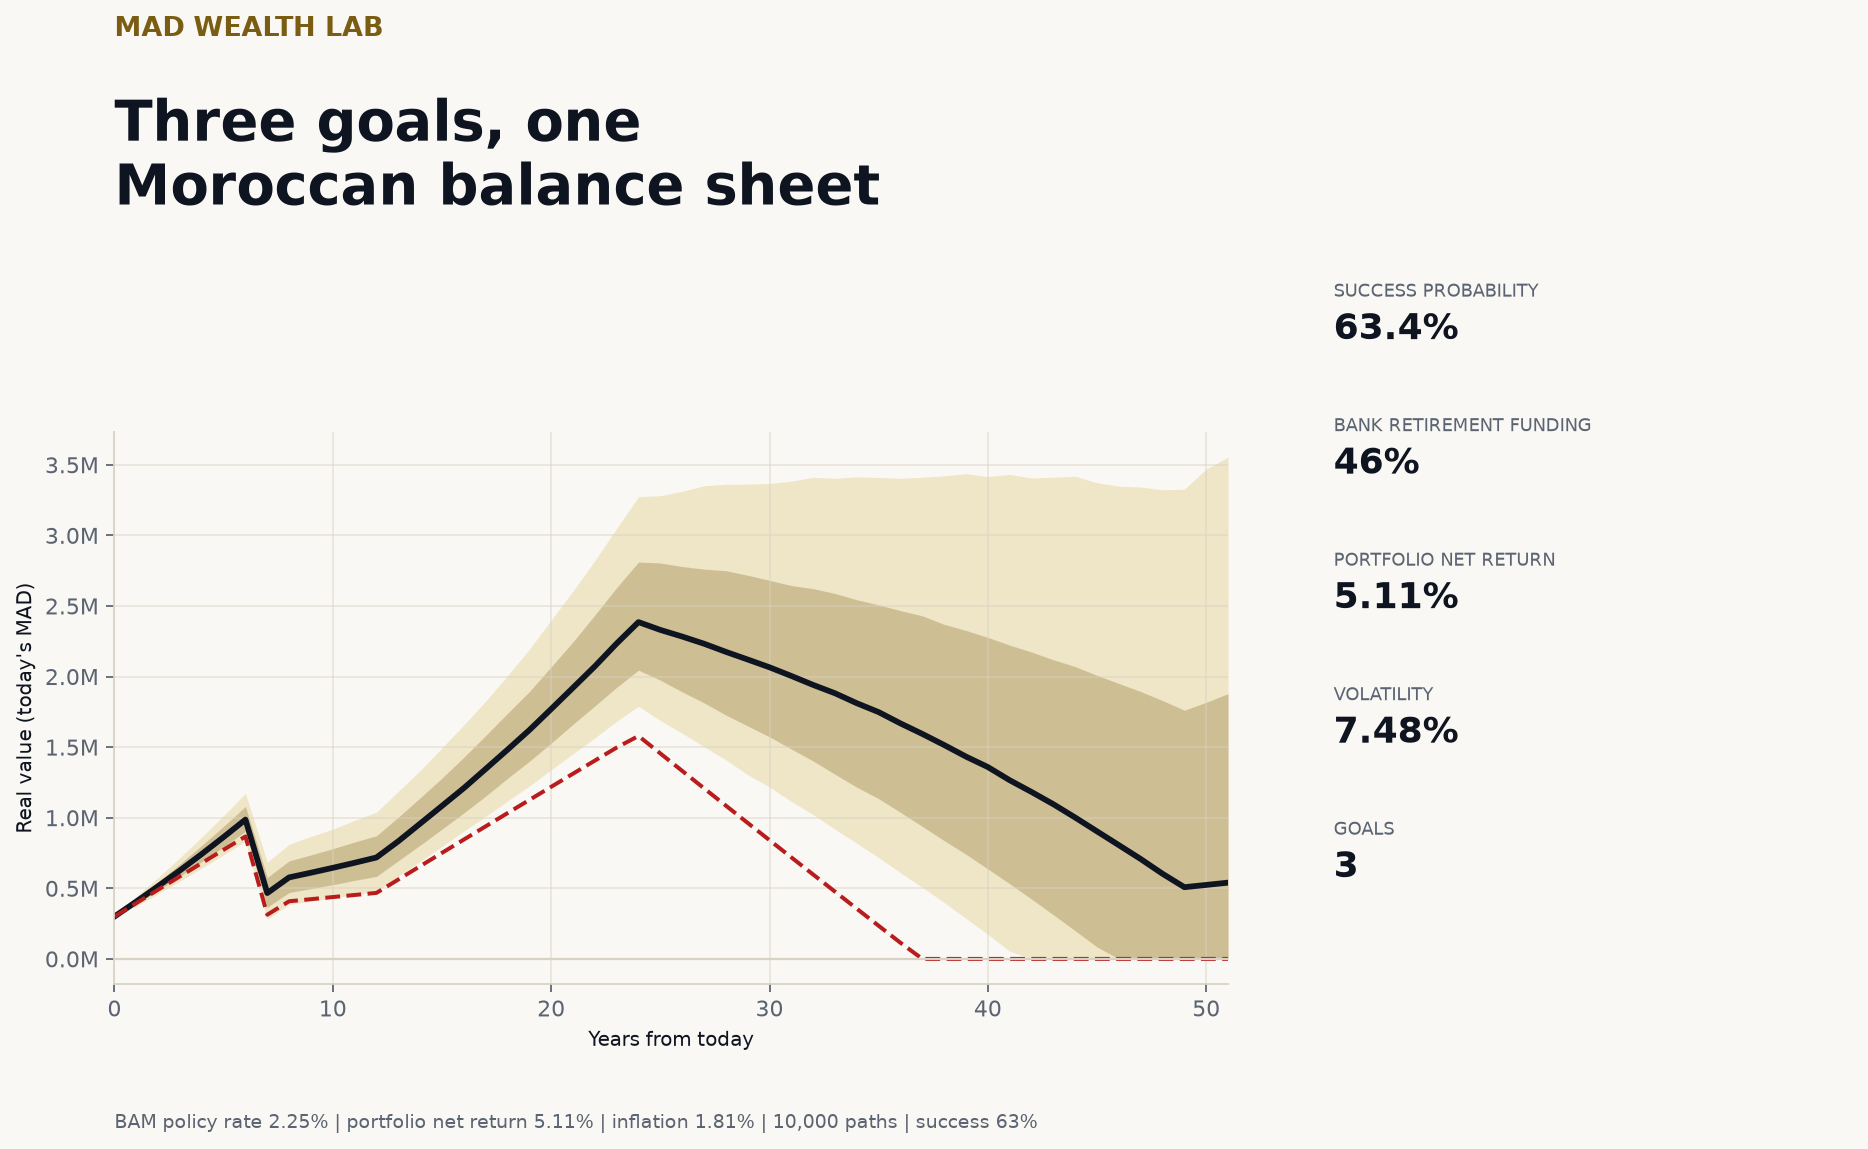
In one paragraph. A 38-year-old Moroccan household has 300,000 MAD invested, saves 8,000 MAD a month, and wants three things: a 648,000 MAD property down payment in seven years, four years of university at 80,000 MAD a year starting in nine years, and 120,000 MAD a year of retirement income from 62 to 87, all in today’s money. I built a goal-based planner on real data — BAM reference yields and the 2.25% policy rate, the MASI from the BVC, COMEX gold converted at USD/MAD, and World Bank inflation — and simulated 10,000 monthly paths with a 55% BVC equity / 25% MAD bonds / 10% gold / 10% USD cash allocation. After Moroccan tax drag from the CGI, the portfolio earns 5.11% net with 7.48% volatility. The plan funds the property and the degree in every path, but retirement only 63.4% of the time: the household runs out before 87 in 36.6% of simulations. A bank deposit at the policy rate (net 1.575%, below 1.81% inflation) funds the first two goals and only 46.5% of retirement, exhausting the portfolio around age 75. Reaching a 75% success probability needs 8,672 MAD a month in the diversified plan, against 13,381 MAD in the bank deposit.
Résumé (français). Un ménage marocain de 38 ans dispose de 300 000 MAD et épargne 8 000 MAD par mois. Trois objectifs : un apport immobilier de 648 000 MAD dans 7 ans, quatre ans d’université à 80 000 MAD par an à partir de la 9e année, et 120 000 MAD par an de retraite de 62 à 87 ans, en MAD d’aujourd’hui. Le planificateur s’appuie sur des données réelles — courbe et taux directeur de Bank Al-Maghrib (2,25 %), MASI de la BVC, or COMEX converti en MAD, inflation de la Banque mondiale — et sur 10 000 trajectoires mensuelles avec une allocation 55 % actions BVC / 25 % obligations MAD / 10 % or / 10 % liquidités USD. Après la fiscalité marocaine du CGI, le portefeuille rapporte 5,11 % net pour 7,48 % de volatilité. L’immobilier et les études sont financés dans tous les scénarios ; la retraite ne l’est qu’à 63,4 %. Un dépôt bancaire au taux directeur (net 1,575 %, sous l’inflation de 1,81 %) ne finance que 46,5 % de la retraite et s’épuise vers 75 ans. Pour viser 75 % de réussite, il faudrait 8 672 MAD par mois en portefeuille diversifié, contre 13 381 MAD en dépôt bancaire.
The household
The plan is deliberately ordinary. One balance sheet, three goals, no separate buckets. The property and education goals are early and relatively small; retirement is late and large. That timing matters more than the product.
| Goal | When | Cost in today’s MAD | Inflation-adjusted cost | Structure |
|---|---|---|---|---|
| Property down payment | Year 7 | 648,000 | 734,729 | 30% of a 1.8M MAD home plus 6% transaction costs |
| University, four years | Years 9–12 | 80,000 / year | 386,425 total | Four annual payments |
| Retirement income | Years 24–48 | 120,000 / year | 5,771,703 total | Monthly withdrawals, 62 to 87 |
At 1.81% average inflation, the three goals cost about 6.9M MAD in nominal terms over 48 years. The household starts with 300,000 MAD and contributes 8,000 MAD a month, indexed to CPI, until retirement. The contribution stream is not enough on its own; the return on capital has to do the rest.
The allocation is the one a Moroccan household can actually build in MAD:
| Asset | Weight | Implementation |
|---|---|---|
| BVC equity | 55% | MASI exposure, direct or via an equity OPCVM |
| MAD sovereign bonds | 25% | BAM-curve instruments or a bond OPCVM |
| Gold | 10% | Gold in MAD, via an ETC/OPCVM or physical |
| USD cash | 10% | USD deposit or money-market fund |
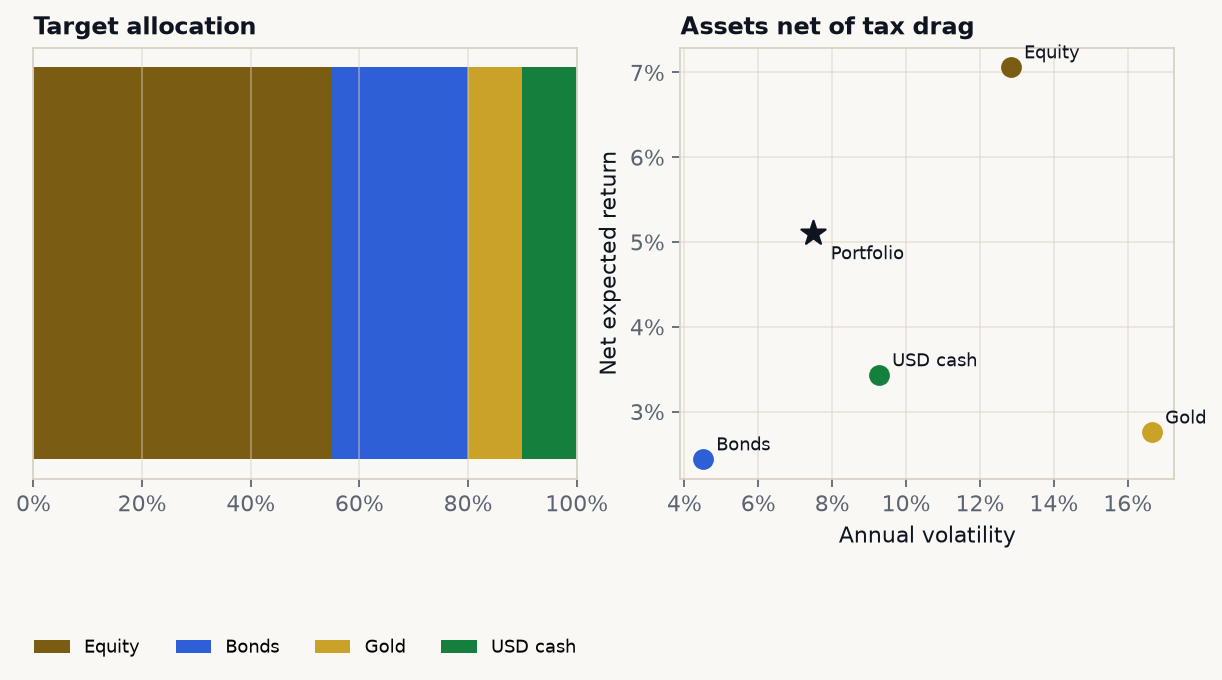
The portfolio sits at 5.11% net expected return and 7.48% volatility. Gold has the highest volatility and a low net return; its job is diversification, not carry.
What the data says
The calibration uses real public series, with assumptions only where a clean Moroccan history does not exist.
| Input | Source | Value used |
|---|---|---|
| BAM policy rate | Bank Al-Maghrib, 16 Oct 2026 | 2.25% |
| BAM 5Y reference yield | Bank Al-Maghrib, 16 Oct 2026 | 3.09% |
| BAM 10Y reference yield | Bank Al-Maghrib, 16 Oct 2026 | 3.63% |
| MASI, 2012–2026 | Bourse de Casablanca | 3.05% CAGR, 12.83% vol |
| Gold in MAD, 2012–2026 | COMEX GC=F × USD/MAD |
7.14% CAGR, 16.65% vol |
| USD/MAD, 2012–2026 | Yahoo Finance MAD=X |
0.95% drift, 9.26% vol |
| Morocco CPI, 2000–2025 | World Bank FP.CPI.TOTL.ZG |
1.81% mean, 1.58% vol |
The BAM curve is the same one behind the MAD yield curve lab: a 16 October 2026 sovereign curve running from 2.13% at three months to 4.38% at 28.5 years. I use the 5-year point for the bond return anchor and the policy rate for the bank-deposit comparison. The BVC series is the cached MASI daily close; the MASI is a price index, so dividends are modelled explicitly through the dividend yield rather than reconstructed from constituents.
Three assumptions are worth stating plainly:
- Equity expected return is 7.50%, not the 3.05% historical CAGR. The 2012–2026 MASI sample was a weak equity decade. Using it as a forward return would be as arbitrary as extrapolating the 2024–2026 rally. I use historical volatility and correlation, but a forward expected return.
- Bond expected return is 3.49% — the 5-year BAM yield plus 40 bp of term/roll — with 4.50% volatility. There is no clean historical BAM curve in the committed data to estimate bond volatility or bond–equity correlation, so those are assumptions, not measurements.
- Gold expected return is 2.81% — CPI plus 1% real — and USD cash is 4.50% — a 3.50% USD deposit rate plus 1.0% MAD depreciation. Both are nominal MAD returns.
The correlations are measured where possible: equity–gold −0.03, equity–USD −0.07, gold–USD +0.32. Bond correlations are assumptions: +0.10 with equity, +0.10 with gold, 0.00 with USD cash.
The tax drag
Taxes are not a footnote over a 48-year horizon. The planner uses asset-level income yield, income tax, capital-gains tax and a turnover assumption. The annual drag is
$$ \text{drag}_i = y_i \tau_i^{income} + \tau_i^{turnover} \tau_i^{CG} \max(\mu_i - y_i, 0), $$where yi is the income yield, τiincome the tax on income, τiturnover the fraction of gains realised each year, and τiCG the capital-gains rate. The rate menu follows the Moroccan Code Général des Impôts:
| Asset | Income yield | Income tax | CGT | Turnover | Drag | Net return |
|---|---|---|---|---|---|---|
| BVC equity | 3.00% | 11.25% | 15% | 15% | 0.44% | 7.06% |
| MAD bonds | 3.50% | 30% | 20% | 10% | 1.05% | 2.44% |
| Gold | 0.00% | — | 20% | 10% | 0.06% | 2.75% |
| USD cash | 3.50% | 30% | 20% | 10% | 1.07% | 3.43% |
The citations matter:
- Dividends: 11.25% in 2026, CGI art. 73-II-B-7° and art. 247-XXXVII-C. The rate falls to 10% in 2027; the planner is a 2026 snapshot.
- Interest: 30% liberatory withholding for individuals outside professional activity, CGI art. 73-II-G-3°.
- Listed-share gains: 15%, CGI art. 73-II-C-1°-a.
- Other security gains, including bonds: 20%, CGI art. 73-II-F-2°.
- Gold: 20% is applied through a gold OPCVM/ETC proxy under CGI art. 73-II-F-2°. Physical gold can have a different treatment; the rate is configurable.
This is an annual effective drag, not lot-level accounting. It ignores the 30,000 MAD annual capital-gains exemption (CGI art. 68), which makes it conservative for small portfolios. It also ignores tax-loss harvesting and the difference between accrual and realisation. Over 48 years, the approximation is still enough to matter: switching tax drag off raises success from 63.4% to 79.5% — 16.1 percentage points.
The Monte Carlo
Each path is a monthly simulation of correlated asset returns, stochastic inflation, and USD/MAD moves. Contributions and goal costs are indexed to the simulated CPI. The portfolio is rebalanced monthly to the target weights; rebalancing taxes are captured through the turnover drag. At each goal date the required amount is withdrawn. If the portfolio cannot meet a payment, the goal is marked as short-funded, the remaining wealth goes to zero, and later contributions can rebuild it.
The success definition is strict: all three goals fully funded. A goal is fully funded only if every scheduled payment is met.
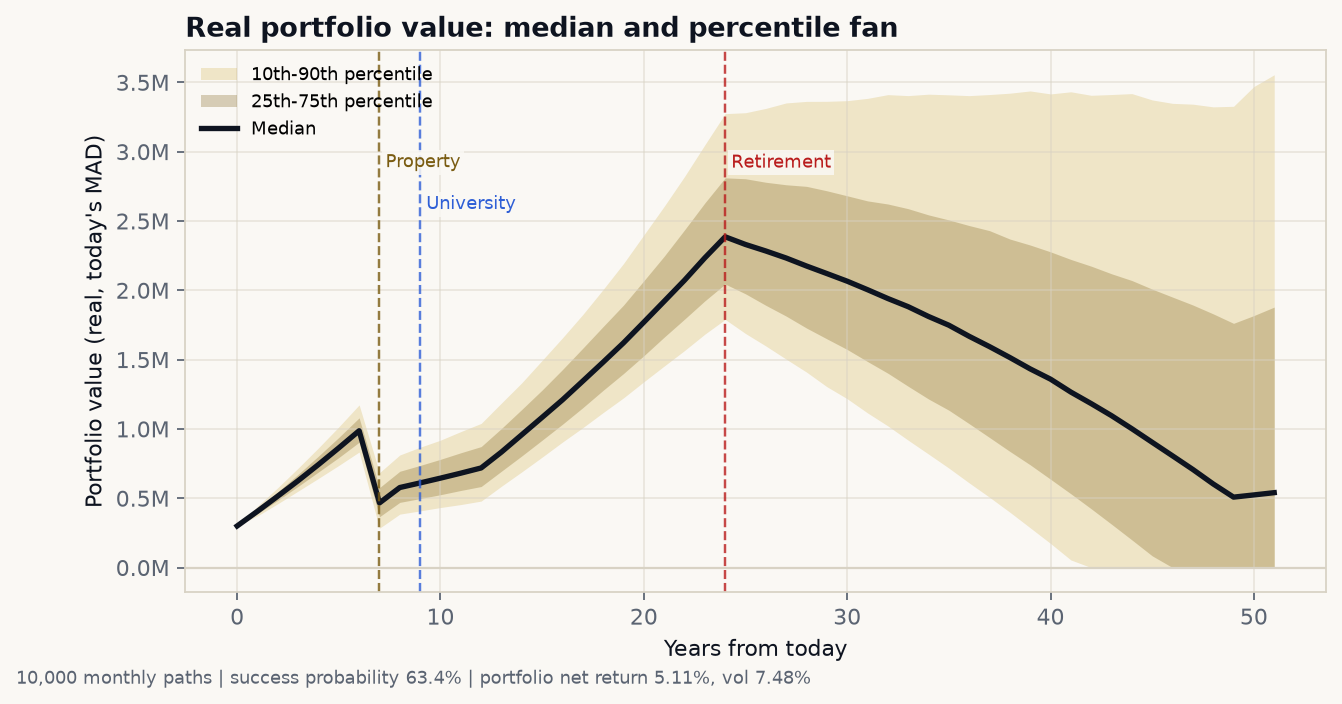
The property withdrawal at year 7 and the four university payments at years 9–12 are visible as drops. Retirement is the long drawdown. The median path ends with about 0.54M MAD real; the 10th percentile ends at zero.
| Metric | Value |
|---|---|
| Overall success | 63.4% |
| Property fully funded | 100% |
| University fully funded | 100% |
| Retirement fully funded | 63.4% |
| Retirement funding ratio, median | 100% |
| Retirement funding ratio, 10th percentile | 65.2% |
| Retirement funding ratio, mean | 90.9% |
| Terminal real wealth, median | 0.54M MAD |
| Terminal real wealth, 10th percentile | 0 |
| Terminal real wealth, 90th percentile | 3.55M MAD |
The plan does not have a property problem or an education problem. It has a retirement problem. The house and the degree are funded early, before the portfolio has had time to compound; retirement is a 25-year liability that starts after 24 years of saving and depends on the tail of the return distribution. The 10th percentile of the retirement funding ratio is 65.2%: in the bad states, the household still funds about two-thirds of retirement spending, not zero.
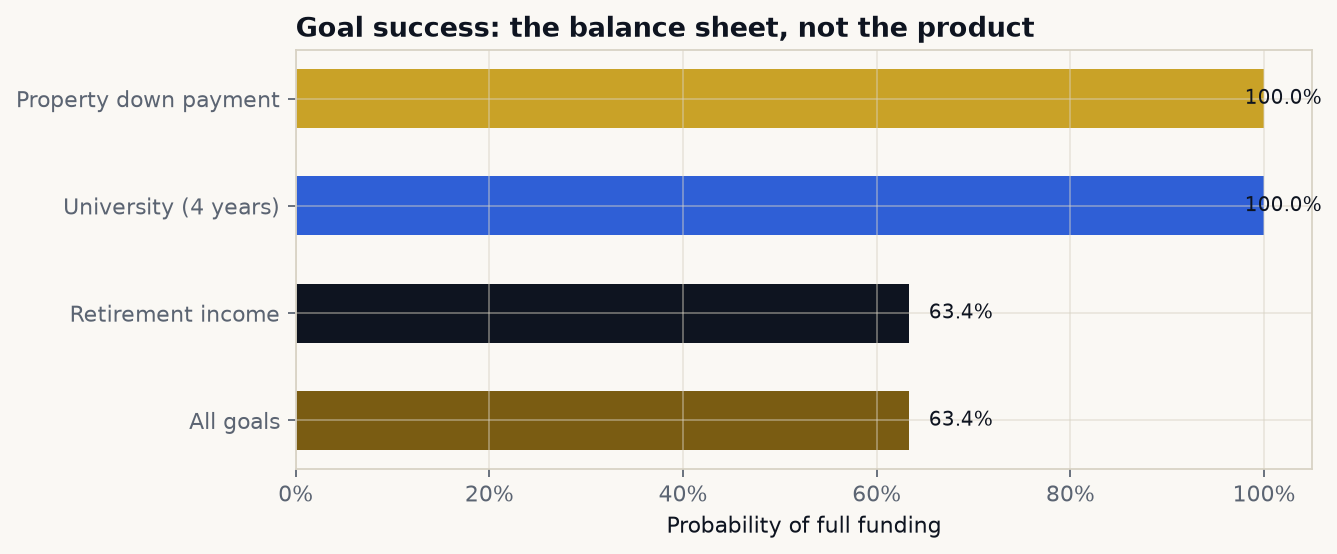
Property and university are 100% funded in the base plan. Retirement is the binding constraint.
Bank deposit vs diversified
The bank-deposit comparator is deliberately simple: the BAM policy rate of 2.25%, taxed at 30% on interest, for a net 1.575%. That is below the 1.81% inflation assumption, so the real return is about −0.23% a year. The deposit is safe in nominal MAD; it is not safe in purchasing power.
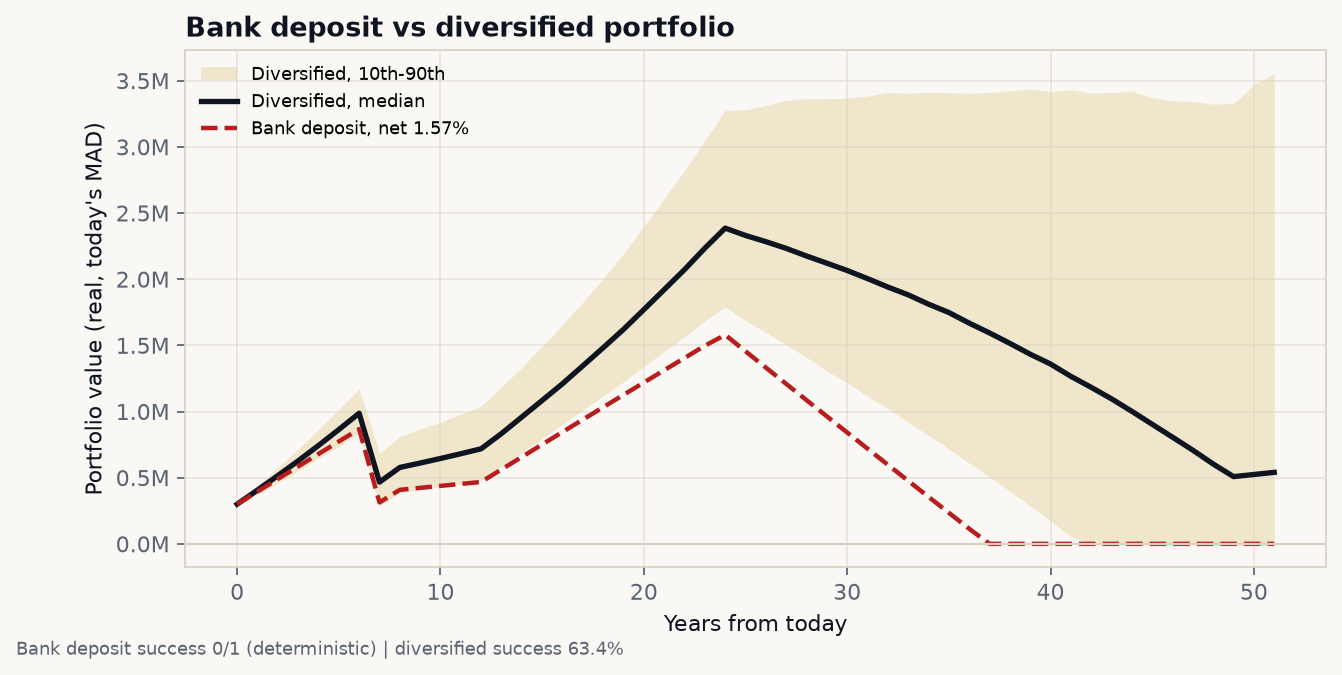
The bank deposit funds the property and the university, then runs out around year 37 — age 75. The diversified median is higher, but the 10th percentile is zero: diversification buys expected return, not a guarantee.
| Metric | Bank deposit | Diversified |
|---|---|---|
| Gross return | 2.25% | 5.11% (net) |
| Tax | 30% on interest | CGI asset menu |
| Net return | 1.575% | 5.11% |
| Property funded | 100% | 100% |
| University funded | 100% | 100% |
| Retirement funding ratio | 46.5% | 100% median |
| All goals funded | No | 63.4% probability |
| Monthly savings for 75% success | 13,381 MAD | 8,672 MAD |
The bank deposit is not a straw man. It funds two of the three goals. It fails because a 1.575% nominal return cannot carry a 25-year inflation-indexed retirement drawdown. To make the deposit work, the household would need to save 13,381 MAD a month, 54% more than the diversified plan’s 8,672 MAD for a 75% success target. That gap is the price of holding no return-seeking assets.
What moves success
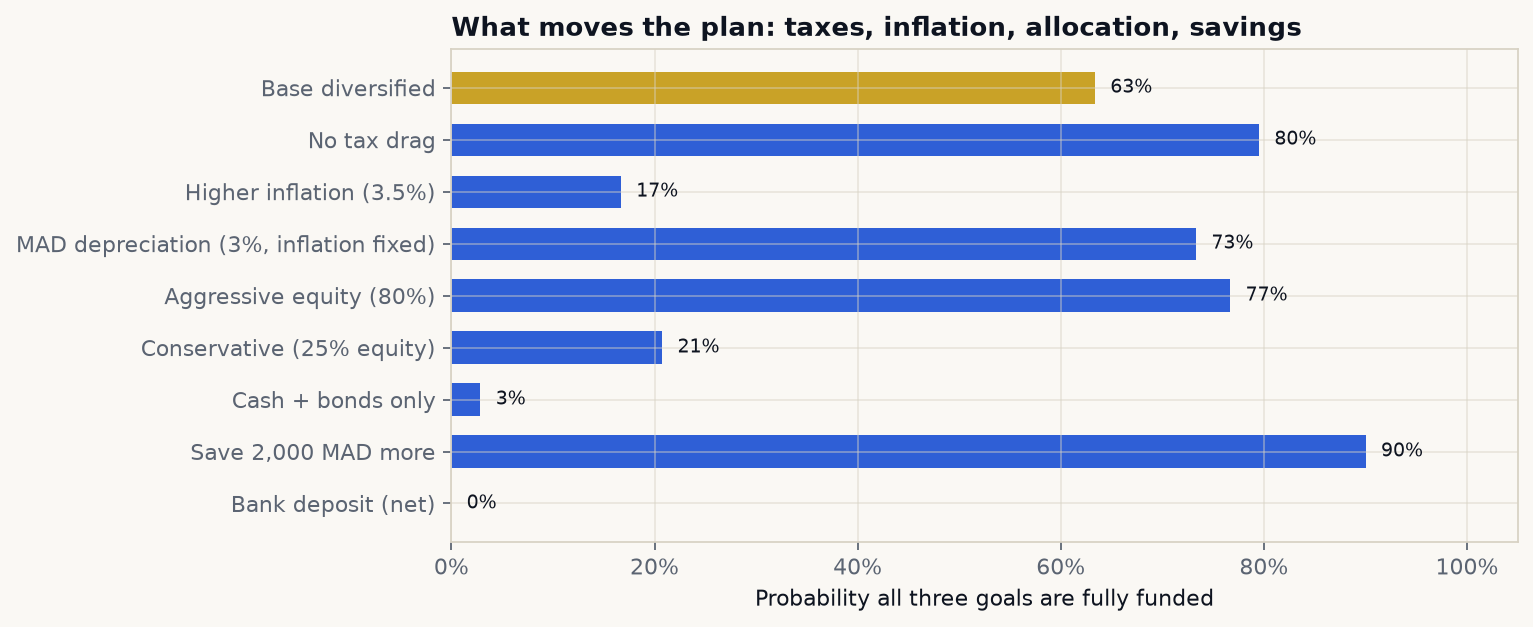
The base plan is 63.4%. Taxes, inflation, equity weight and the savings rate all move it by more than a few points.
| Scenario | All goals | Retirement funded | Median terminal real |
|---|---|---|---|
| Base diversified | 63.4% | 63.4% | 0.54M |
| No tax drag | 79.5% | 79.5% | 1.45M |
| Higher inflation (3.5%) | 16.7% | 16.7% | 0.00M |
| MAD depreciation (3%, inflation fixed) | 73.3% | 73.3% | 1.06M |
| Aggressive equity (80%) | 76.7% | 76.7% | 1.76M |
| Conservative (25% equity) | 20.8% | 20.8% | 0.00M |
| Cash + bonds only | 2.9% | 2.9% | 0.00M |
| Save 2,000 MAD more | 90.0% | 90.0% | 2.29M |
| Bank deposit (net) | 0.0% | 46.5% funding | 0.00M |
Three results stand out:
- Inflation is the largest single risk. Raising mean inflation from 1.81% to 3.5% cuts success from 63.4% to 16.7%. The goal costs are indexed, so inflation hits both the liability and the real value of the portfolio. A household that fixes the nominal goal amounts instead would be making a different, and much more optimistic, assumption.
- Tax drag is worth 16 points of success. The equity dividend rate, the 30% interest tax and the 15%/20% capital-gains rates compound over five decades. The 30,000 MAD exemption is ignored; a small portfolio would do slightly better.
- MAD depreciation is a hedge, not a risk, for this balance sheet. Raising the USD/MAD drift from 1% to 3%, with inflation held fixed, raises success from 63.4% to 73.3% and lifts the median terminal value from 0.54M to 1.06M real. The 20% gold/USD sleeve does its job. If the depreciation passes through to inflation, the benefit shrinks; the 3.5% inflation row is the relevant stress.
The allocation and savings sensitivities are monotone:
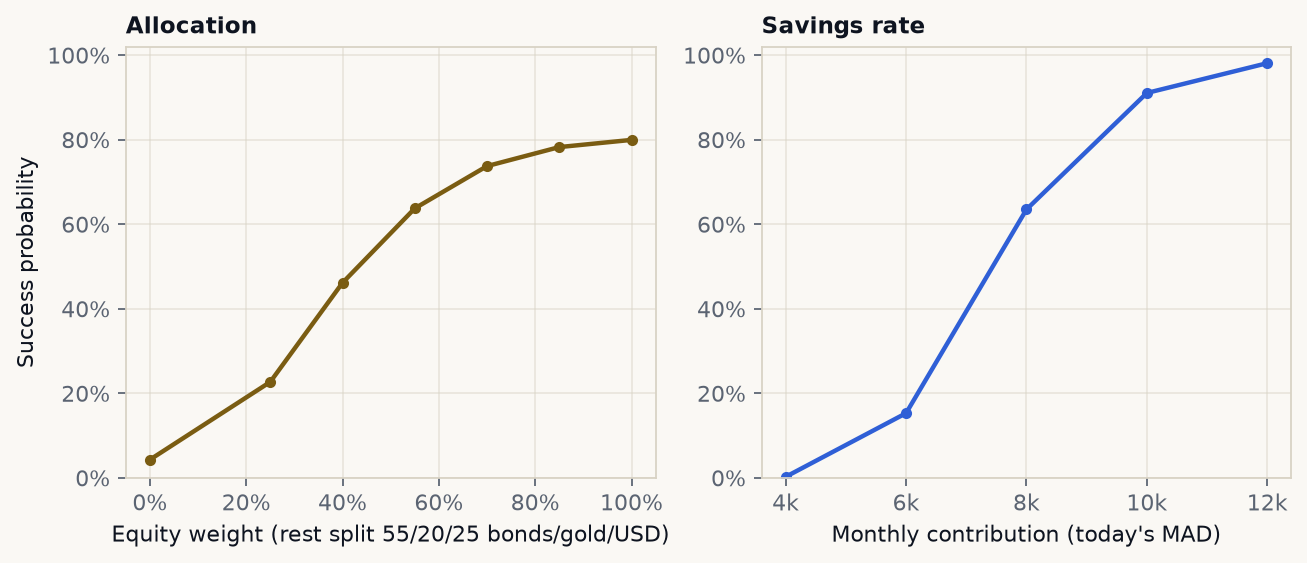
Success rises with equity exposure up to about 85–100%, but the marginal gain flattens. Savings dominate: moving from 8,000 to 10,000 MAD a month is worth more than moving from 55% to 100% equity.
Equity weight vs success
| Equity weight | Success |
|---|---|
| 0% | 4.3% |
| 25% | 22.7% |
| 40% | 46.2% |
| 55% | 63.8% |
| 70% | 73.8% |
| 85% | 78.3% |
| 100% | 80.0% |
Monthly savings vs success
| Monthly savings | Success |
|---|---|
| 4,000 MAD | 0.3% |
| 6,000 MAD | 15.3% |
| 8,000 MAD | 63.5% |
| 10,000 MAD | 91.1% |
| 12,000 MAD | 98.1% |
The 55% row is from a 2,000-path sensitivity run; the 10,000-path base is 63.4%. The difference is Monte Carlo noise, not a different model.
Move the goals yourself
Scroll to load the interactive planner.
Drag the sliders. The widget reruns a 1,200-path version of the same monthly engine in the browser: change the monthly savings, retirement spending or age, the property price, the university cost, the equity weight, inflation, or turn tax drag off. The fan chart, success probability and goal bars update. The static exhibits use 10,000 paths; the interactive preview uses 1,200 for speed.
Limitations
- BAM reference yields are indicative, not executable. The 5-year point is an interpolation of the reference curve, not a dealer quote.
- The MASI is a price index. Dividends are a yield assumption, not a reconstruction of the constituents. The historical CAGR is sample-specific and weak.
- Bond volatility and bond correlations are assumptions. There is no historical BAM curve in the committed data. A bond OPCVM has credit, liquidity and management-fee risk not modelled here.
- Tax drag is an annual effective rate. It ignores lot-level cost bases, the 30,000 MAD exemption, tax-loss harvesting, and the difference between accrual and realisation. The gold rate is applied through an OPCVM/ETC proxy; physical gold can differ.
- The Monte Carlo assumes stable expected returns, volatilities and correlations. Regime shifts, a inflation shock, or a change in the MAD peg would break the calibration.
- Goals are deterministic in date and amount. A real household can delay the property purchase, choose a public university, or adjust retirement spending. Those flexibilities are valuable and not modelled.
- No pension, rental property, emergency fund, insurance, or liquidity constraint. The planner is a savings-and-investing exercise, not a full household cash-flow model.
- The bank deposit is a benchmark, not a quote. Posted term-deposit rates vary by bank, amount and maturity; the 2.25% policy rate is a conservative proxy.
The point of the project is not that 63.4% is the right number. It is that a goal-based plan is a balance sheet problem, not a product problem. The property and the degree are easy; retirement is the liability that decides whether the plan works. Taxes and inflation are not side notes. And a bank deposit can be safe in nominal MAD while losing purchasing power in real terms.
Résumé français
Ce projet construit un planificateur d’objectifs pour un ménage marocain. Le point de départ est simple : 300 000 MAD d’épargne, 8 000 MAD par mois, et trois objectifs — un apport immobilier de 648 000 MAD dans 7 ans, quatre années d’université à 80 000 MAD par an dès la 9e année, et 120 000 MAD par an de retraite de 62 à 87 ans, en MAD d’aujourd’hui. Le portefeuille est investi à 55 % en actions de la BVC, 25 % en obligations souveraines MAD, 10 % en or et 10 % en liquidités USD.
Les données sont réelles lorsqu’elles sont disponibles : la courbe de référence et le taux directeur de Bank Al-Maghrib au 16 octobre 2026 (2,25 %), le MASI de la Bourse de Casablanca de 2012 à 2026, l’or COMEX converti en MAD au taux USD/MAD, et l’inflation marocaine de la Banque mondiale (1,81 % en moyenne sur 2000–2025, 1,58 % de volatilité). Les rendements attendus sont des hypothèses forward-looking : 7,50 % pour les actions, 3,49 % pour les obligations (5 ans BAM + 40 pb), 2,81 % pour l’or (inflation + 1 %) et 4,50 % pour les liquidités USD (3,50 % de taux USD + 1 % de dépréciation du MAD). Après la fiscalité du CGI, le rendement net du portefeuille est de 5,11 % pour 7,48 % de volatilité.
La fiscalité suit le CGI : dividendes à 11,25 % en 2026 (art. 73-II-B-7° et 247-XXXVII-C), intérêts à 30 % libératoire (art. 73-II-G-3°), plus-values sur actions cotées à 15 % (art. 73-II-C-1°-a) et sur autres titres à 20 % (art. 73-II-F-2°). Le coût fiscal annuel est de 0,44 % sur les actions, 1,05 % sur les obligations, 0,06 % sur l’or et 1,07 % sur les liquidités USD. Elle coûte 16,1 points de probabilité de réussite sur 48 ans.
Avec 10 000 trajectoires mensuelles, le plan finance l’immobilier et les études dans 100 % des cas, mais la retraite seulement 63,4 % du temps. Le ratio de financement médian de la retraite est de 100 %, mais son 10e percentile est de 65,2 %. La richesse terminale médiane en termes réels est de 0,54 M MAD ; le 10e percentile est nul. Un dépôt bancaire au taux directeur, net de 1,575 %, finance l’immobilier et les études mais seulement 46,5 % de la retraite : le portefeuille s’épuise vers 75 ans. Pour viser 75 % de réussite, il faudrait 8 672 MAD par mois en portefeuille diversifié, contre 13 381 MAD en dépôt bancaire.
Les sensibilités sont nettes : sans fiscalité, la réussite monte à 79,5 % ; avec une inflation à 3,5 %, elle tombe à 16,7 % ; avec 80 % d’actions, elle atteint 76,7 % ; avec 25 % d’actions, 20,8 % ; avec un dépôt bancaire, 0 % pour l’ensemble des objectifs. Une dépréciation du MAD à 3 % par an, à inflation inchangée, fait monter la probabilité globale à 73,3 % et la richesse terminale médiane à 1,06 M MAD : l’or et les liquidités USD jouent leur rôle de couverture. Si la dépréciation se transmet à l’inflation, le bénéfice se réduit ; le scénario d’inflation à 3,5 % est le stress pertinent.
Le widget interactif permet de modifier l’épargne mensuelle, la dépense de retraite, l’âge de départ, le prix du bien, le coût des études, le poids des actions, l’inflation et la fiscalité. Le graphique en éventail et la probabilité de réussite se recalculent dans le navigateur. Les données et les sorties du widget sont publiées dans /data/wealth-lab.json ; la méthodologie et les tests sont documentés dans cette étude de cas.
Reproducibility
cd mad-wealth-lab
python3 -m venv .venv
source .venv/bin/activate
pip install -r requirements.txt

python3 wealth_planner.py selftest
python3 wealth_planner.py analyze
python3 -m unittest discover -s tests -v
Data: Bank Al-Maghrib reference yields and policy rate, value date 16 October 2026; Bourse de Casablanca MASI daily closes, 26 March 2012 to 14 October 2026; Yahoo Finance MAD=X and COMEX GC=F, 2012–2026; World Bank FP.CPI.TOTL.ZG for Morocco, 1960–2025. The raw files are committed under data/; outputs/ contains the analytics, scenarios, fan chart, widget payload and cover. The widget payload is published at /data/wealth-lab.json; the methodology and tests are documented in this case study.
Not investment advice. This is a household planning exercise on public data, not a recommendation on any security. Tax treatment depends on individual circumstances; the CGI citations are a 2026 snapshot, not a tax opinion.
