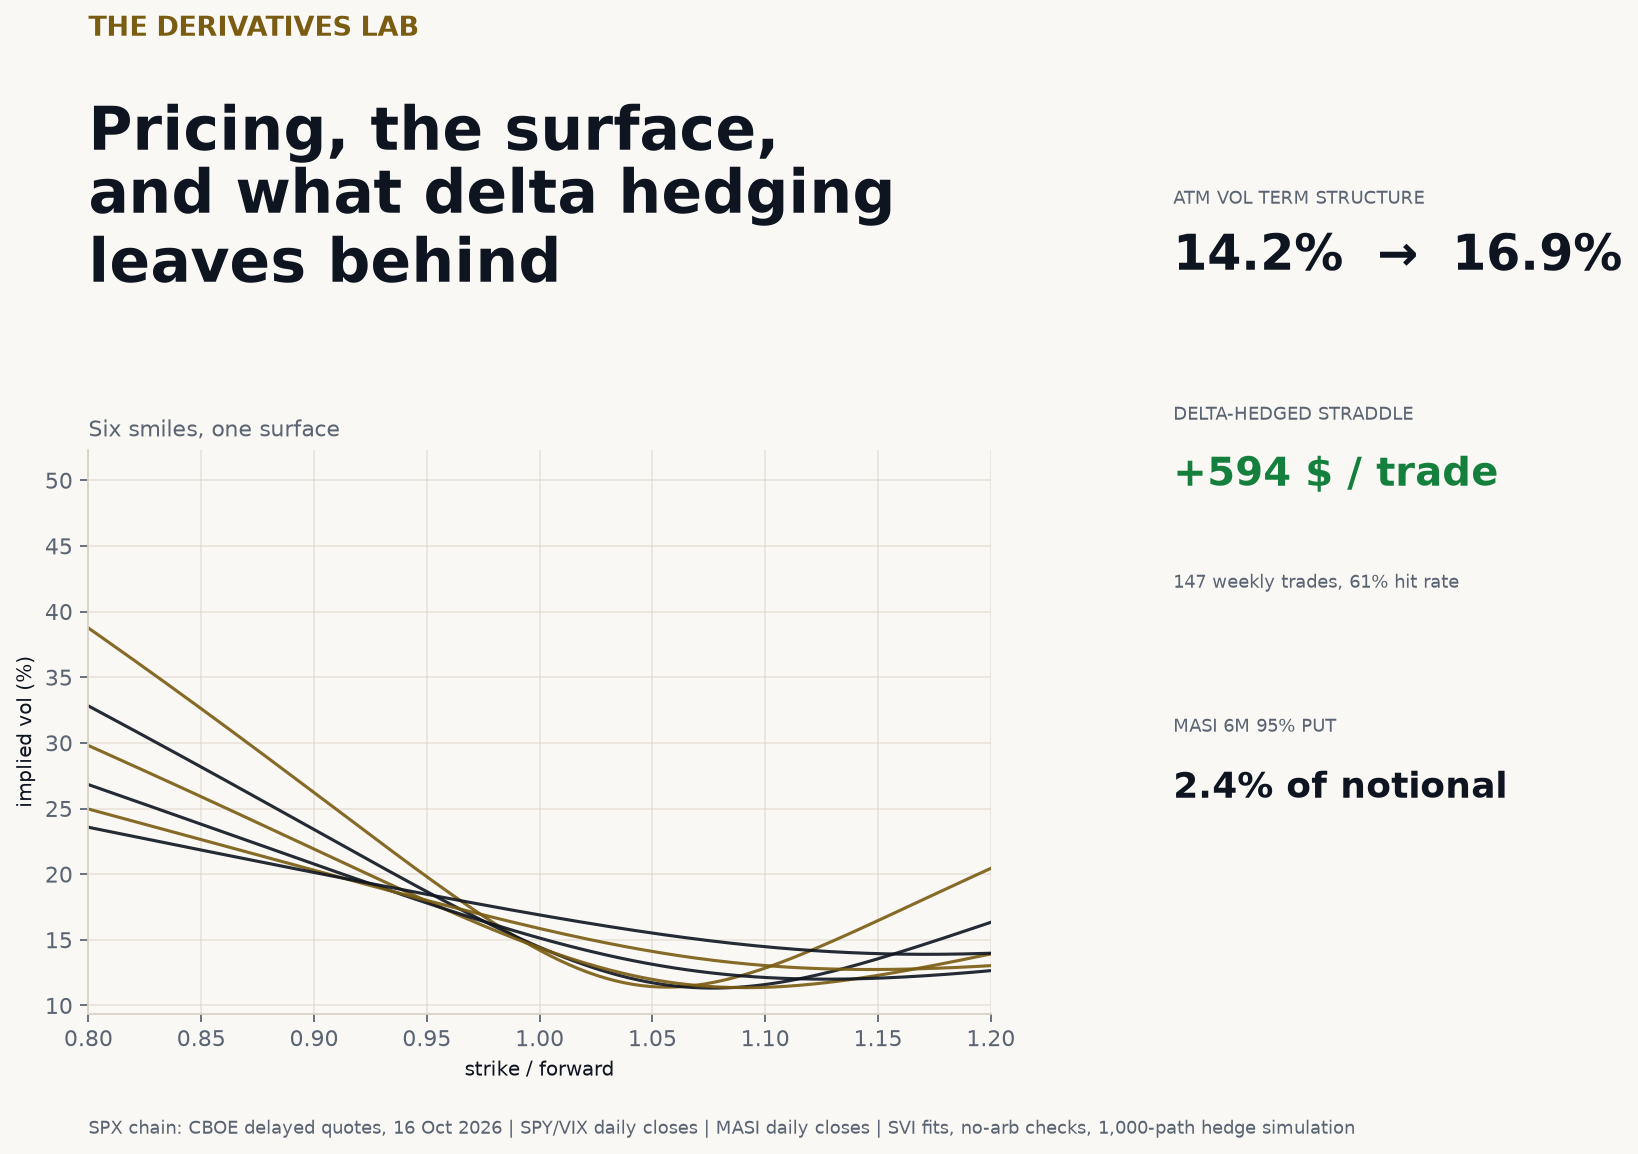
In one paragraph. Options are three problems in one: what is it worth, what does the market imply, and what does the hedge actually leave behind. This lab does all three on real data. From 2,565 SPX quotes across six expiries, I back out forwards and discount factors from put-call parity, fit butterfly-constrained SVI smiles (0.31 vol points of SVI RMSE at worst, 0.03 vol points median difference against CBOE’s own IVs), and show a term structure that runs from 14.2% at five weeks to 16.9% at fourteen months. Pricing is checked three ways: the closed form, a CRR tree, and Monte Carlo with a stock control variate (78% variance cut) and a geometric-Asian control (99.96% variance cut). Hedging is where it gets interesting: delta-hedging a short 3M ATM call leaves a 23 index-point standard deviation in terminal P&L; adding a 2% OTM call to zero gamma cuts the variance by 85%. A real-data check — 147 weekly 21-day SPY straddles sold at VIX and delta-hedged daily — earned 24.5% of premium on average, with a -$4,000 fifth-percentile tail. Finally, because Casablanca has no listed options, I price a six-month 95% MASI put on realized vol: 2.39% of notional.
Résumé (français). Les options posent trois questions à la fois : que vaut le contrat, que dit le marché, et que reste-t-il réellement après la couverture ? Ce projet y répond sur des données réelles : 2 565 cotations SPX sur six échéances, forwards et facteurs d’actualisation extraits de la parité put-call, surfaces SVI contraintes (aucun arbitrage papillon), pricing BSM / binomial / Monte-Carlo avec convergence, et une comparaison delta contre delta-gamma. La couverture delta laisse un écart-type de 23 points d’indice sur le P&L terminal ; ajouter un call à 2 % pour annuler le gamma réduit la variance de 85 %. Un test sur données réelles — 147 straddles SPY à 21 jours vendus au VIX et couverts en delta — rapporte 24,5 % de la prime en moyenne, avec une queue à -4 000 $. Enfin, faute de marché d’options à Casablanca, je price un put MASI 6 mois à 95 % sur volatilité réalisée : 2,39 % du notionnel.
The price is the easy part
Start with the model everyone knows. For a European option on a dividend-paying underlying:
$$ C = S e^{-qT} N(d_1) - K e^{-rT} N(d_2), \qquad d_{1,2} = \frac{\ln(S/K) + (r-q \pm \tfrac12\sigma^2)T}{\sigma\sqrt{T}}. $$The interesting question is not whether I can evaluate that formula. It is whether the number survives a different numerical method and a different set of assumptions. So the lab prices the same 3-month ATM call on a 100 index (σ = 20%, r = 4%, q = 1.2%) three ways:
- Closed form: 4.3194.
- CRR binomial, 500 steps: 4.3174 — 0.0020 away. The error oscillates because the strike does not sit exactly on a tree node, and the log-log slope in the chart is −1, not −2. That is the honest convergence rate of a plain CRR tree, not a bug.
- Monte Carlo, 100,000 paths with a stock control variate: 4.3090, standard error 0.0094. The control variate uses the terminal stock price, whose mean is known; it cuts variance by 78.3%.
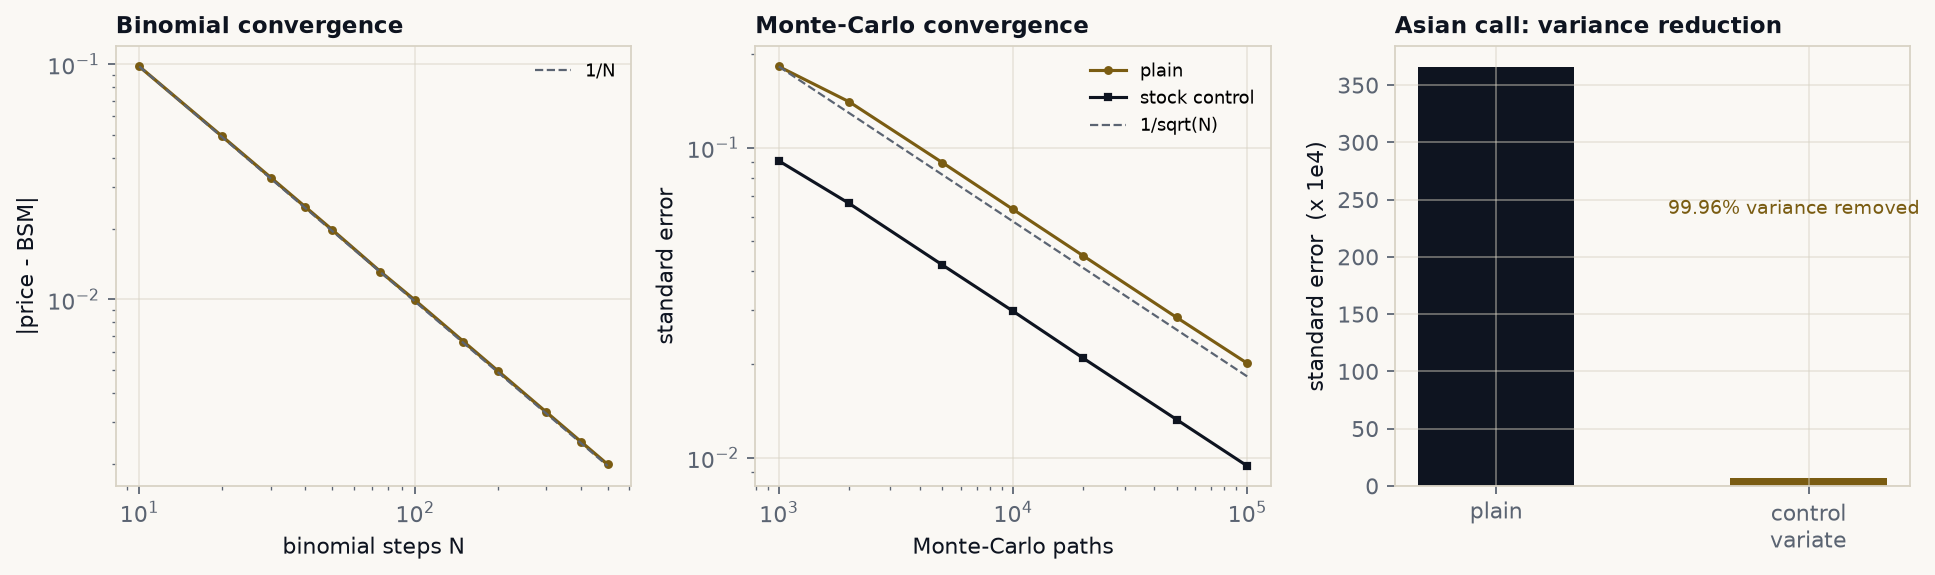
The binomial error follows 1/N. The Monte-Carlo control variate sits an order of magnitude below the plain estimator by 100,000 paths. The Asian call’s geometric control removes 99.96% of the variance at 20,000 paths.
The tree also prices an American put; at these parameters the early-exercise premium is 0.0546 index points. The Monte-Carlo engine prices an arithmetic Asian call with the discrete geometric average as a control variate — a payoff with no simple closed form, where Monte Carlo is not optional. That is the reason to have all three engines: not to prove they agree, but to know which one carries the assumption you cannot avoid.
The market does not have one volatility
The SPX snapshot is 2,565 valid quotes across six standard expiries, from 35 days to 14 months. The first job is to recover the forward and the discount factor without importing a rate or a dividend yield. For each expiry, put-call parity gives
$$ C - P = D\,(F - K), $$so regressing the call-minus-put mid on the strike gives the discount factor as minus the slope and the forward as the intercept divided by it. The regression uses strikes between 82% and 118% of spot; the fit is essentially exact because SPX options are European and cash-settled.
| Expiry | T (yrs) | Forward | Implied r | Implied q | ATM vol | SVI RMSE (vol pts) |
|---|---|---|---|---|---|---|
| 20 Nov 2026 | 0.096 | 7,677.77 | 4.06% | 1.57% | 14.21% | 0.305 |
| 18 Dec 2026 | 0.173 | 7,696.97 | 4.47% | 1.64% | 14.43% | 0.139 |
| 15 Jan 2027 | 0.249 | 7,725.83 | 4.68% | 1.21% | 14.39% | 0.082 |
| 19 Mar 2027 | 0.422 | 7,772.68 | 4.62% | 1.14% | 15.13% | 0.072 |
| 17 Jun 2027 | 0.668 | 7,852.92 | 4.85% | 1.12% | 15.86% | 0.027 |
| 17 Dec 2027 | 1.170 | 8,021.93 | 4.96% | 1.01% | 16.89% | 0.009 |
The implied rate curve is 4.1% to 5.0%; the implied dividend yield settles near 1.1–1.6%. The forward rises 4.5% from 35 days to 14 months, consistent with a 4–5% rate minus a 1.0–1.6% dividend yield.
Each expiry is fitted with an SVI total-variance curve,
$$ w(k) = a + b\left(\rho(k-m) + \sqrt{(k-m)^2 + \sigma^2}\right), \qquad k = \ln(K/F), $$with a soft penalty for negative butterfly density. All six slices pass the butterfly condition to within 3×10⁻⁵; the 35-day slice needed the penalty and still fits to 0.31 vol points. There is one small calendar violation between the 2M and 3M slices (4.9×10⁻⁴ in total variance). I left it visible rather than force a monotone surface: independent per-expiry fits are the honest description of the raw quotes, and a production surface would add a calendar penalty or fit jointly.
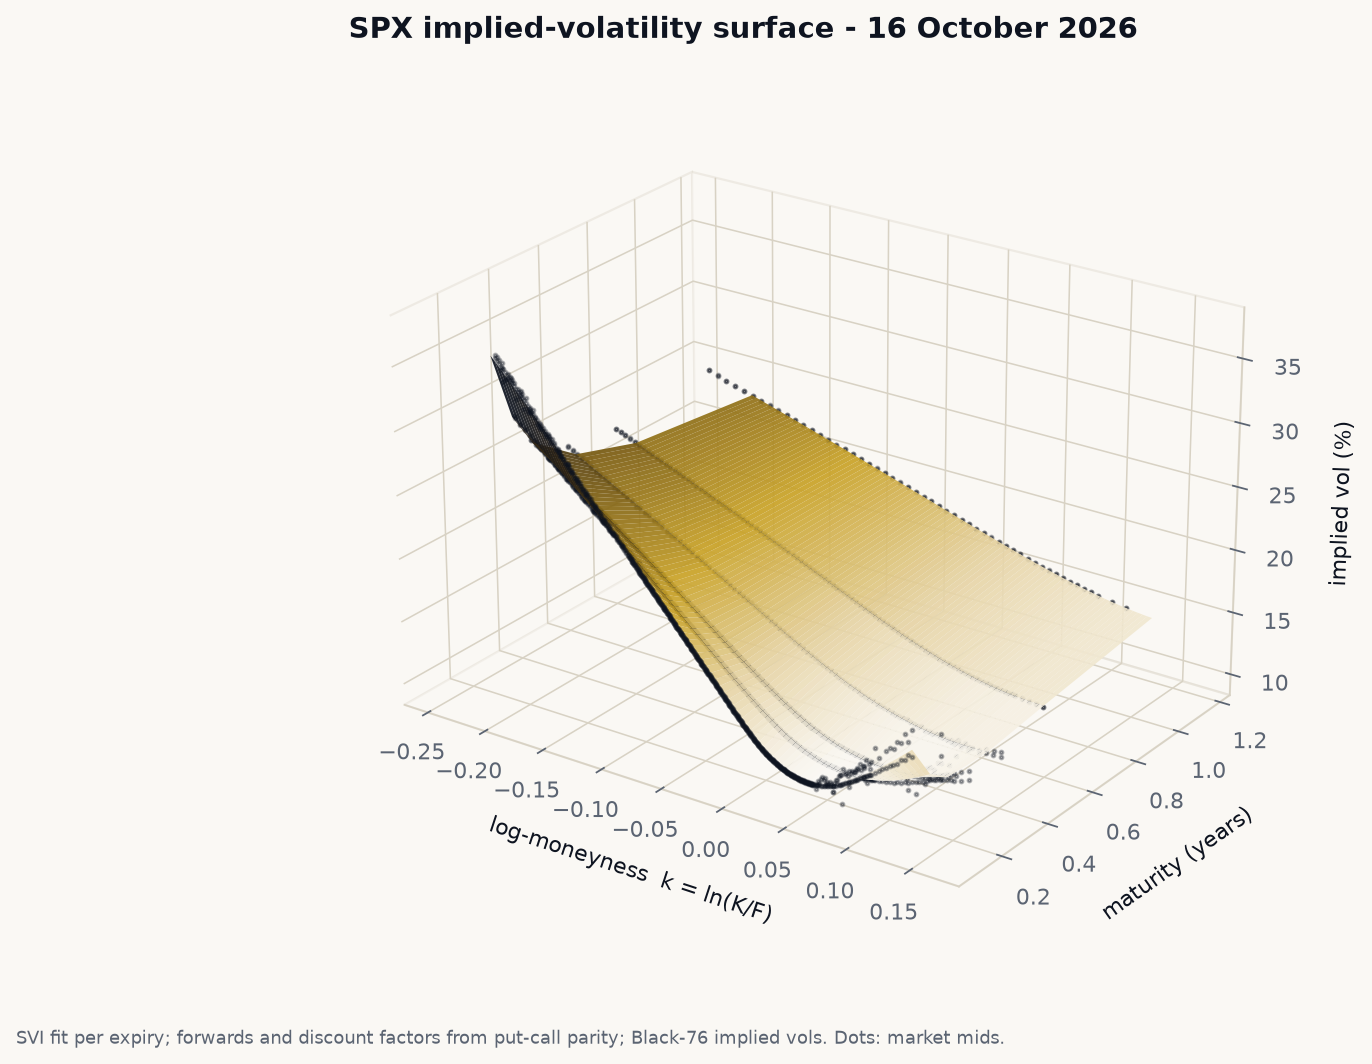
Six SVI smiles, one surface. The short end has a pronounced smile; the long end is closer to a monotone skew. Dots are market mids, not trades.
The cross-check against CBOE’s own implied vols is reassuring: 0.032 vol points median absolute difference and 0.161 at the 90th percentile across 2,560 overlapping quotes. That is not independent — it uses the same mids — but it validates the forward, discount and Black-76 inversion pipeline end to end.
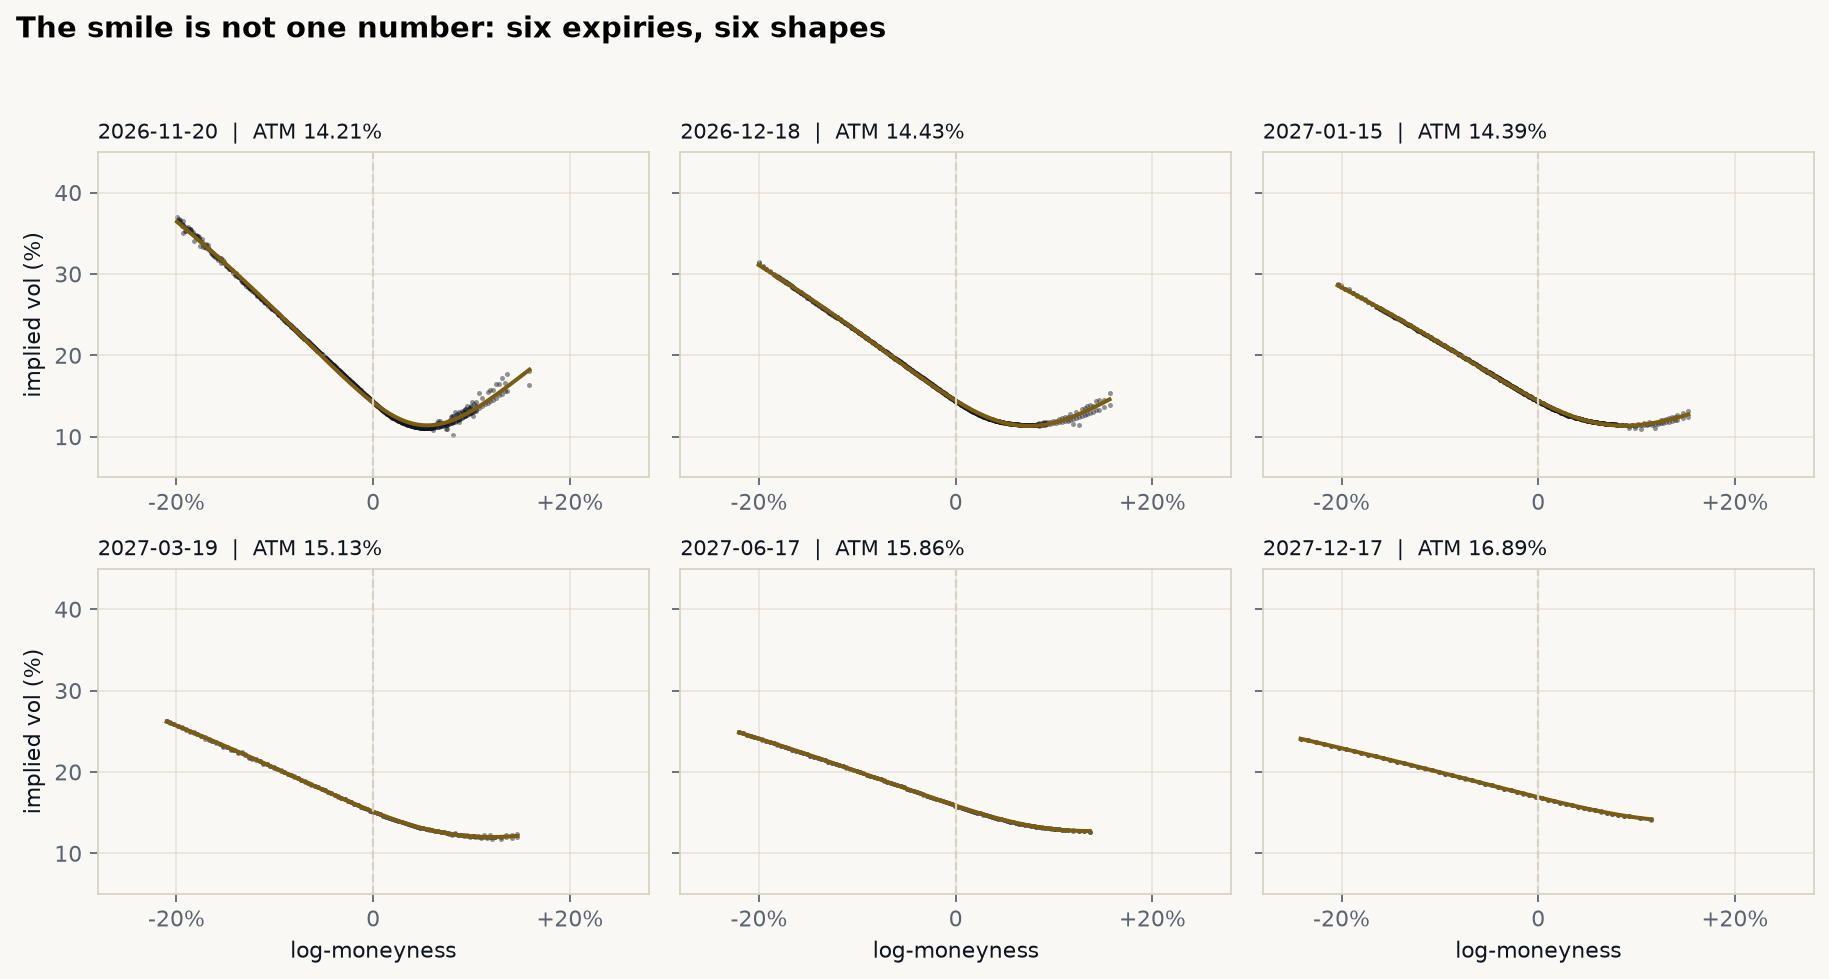
The first expiry has the deepest smile; the 14-month slice is a flatter, downward-sloping skew. A single ATM volatility would miss all of this.
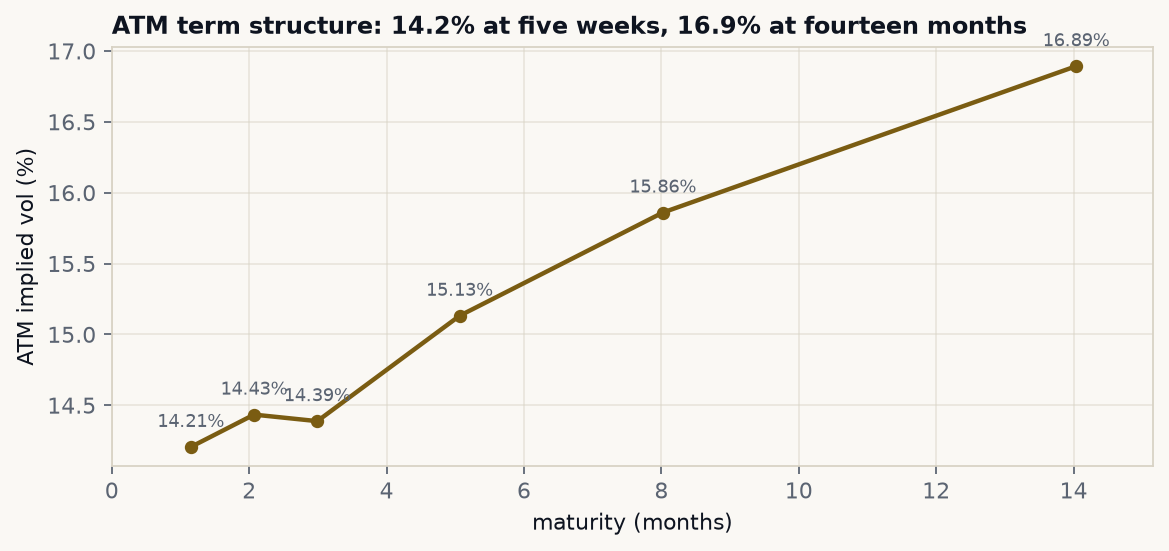
The ATM term structure is upward sloping, with a small dip around three months: 14.2% at five weeks, 16.9% at fourteen months.
Greeks are local; the hedge is not
The Greeks are the derivatives of the price with respect to one variable at a time. For the 3M ATM call, delta is 0.56, gamma is 0.00071 per index point, vega is 15.0 per vol point, and theta is −1.56 per day. Those numbers are local: they describe the next small move, not the next month.
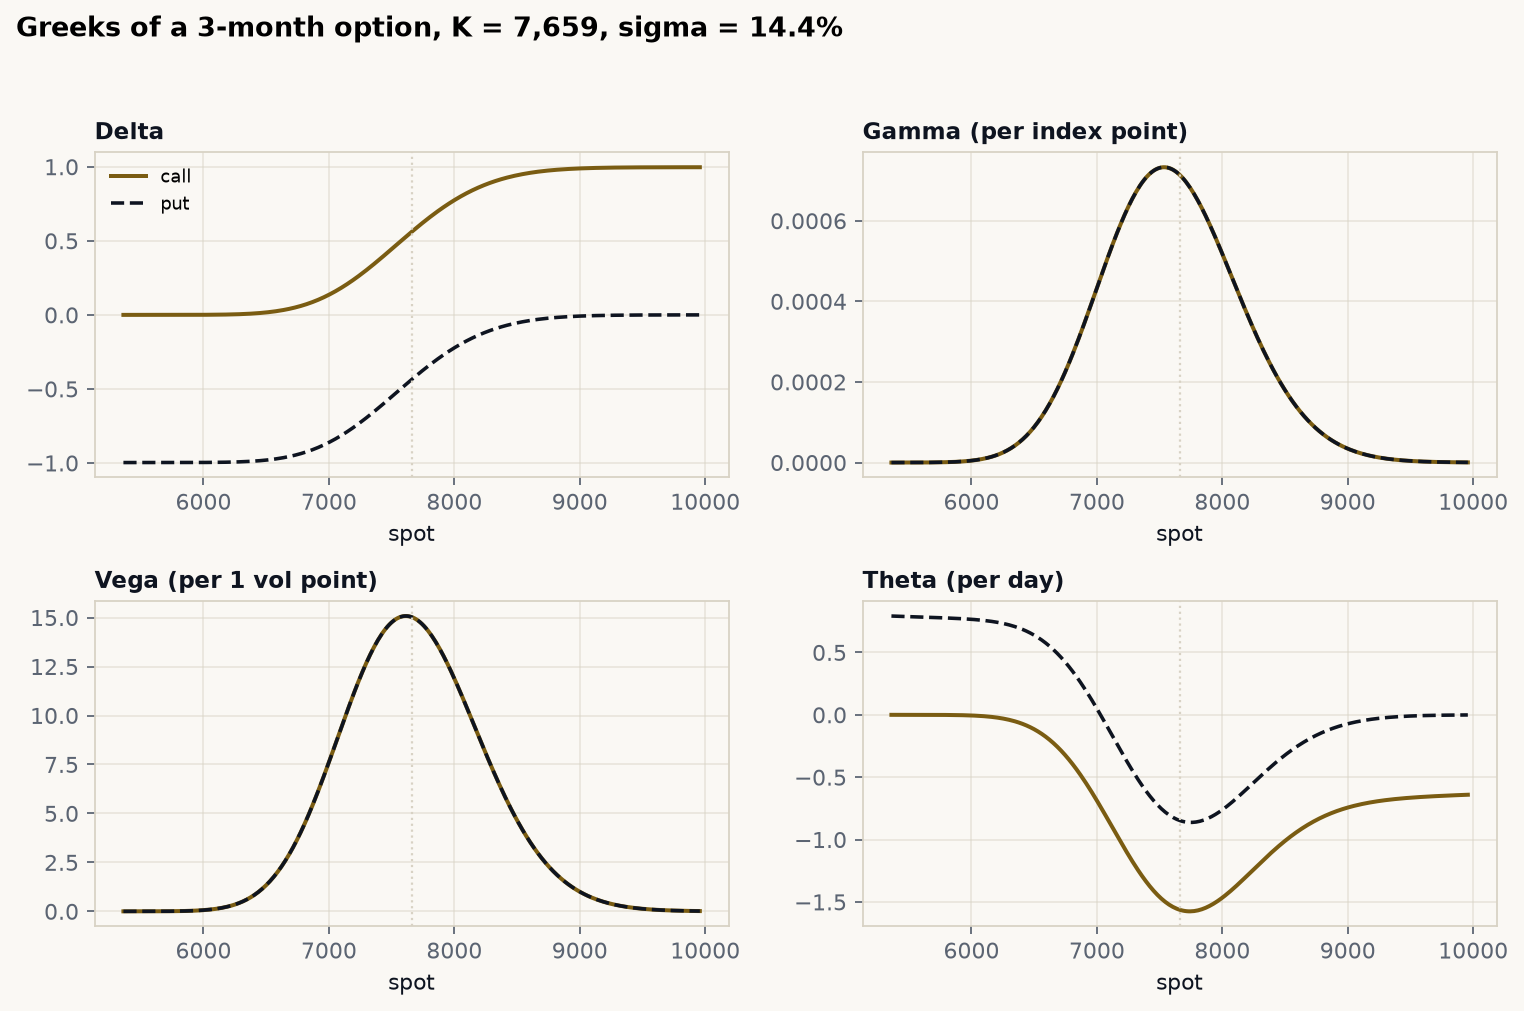
Gamma and vega peak at the strike; theta is most negative there. The put’s theta turns positive far out of the money because the interest on the strike dominates the time decay.
The gamma-theta trade is the whole game. A delta-hedged short option earns theta and pays for realized gamma. In continuous time, with the same volatility used to price and to hedge, the two cancel exactly. In discrete time they do not — and if realized volatility differs from implied, the residual is not noise. It is the position.
What delta hedging leaves behind
I sold one 3M ATM call at the surface’s 14.39% ATM vol, with r = 4.68% and q = 1.21%, and simulated 1,000 daily paths. Two strategies:
- Delta only: rebalance shares every day to zero delta.
- Delta + gamma: also hold a 2% OTM call at the same expiry, sized each day to zero portfolio gamma, then rebalance shares to zero delta.
Both pay 2 bp on share trades and 5 bp on the hedge option. The sold option is held to expiry. The flat-vol comparison prices the second option at the same 14.39% rather than at the lower OTM implied vol, so the result isolates hedging from a skew trade.
| Strategy | Mean P&L | Std | 5th pct | 95th pct | Mean cost |
|---|---|---|---|---|---|
| Delta only | -4.33 | 23.06 | -41.66 | 32.15 | 3.78 |
| Delta + gamma | -2.76 | 9.05 | -13.73 | 6.74 | 2.50 |
The means are negative mainly because of transaction costs: the gross means are within simulation noise of zero. The important number is the dispersion. Adding the second option cuts the standard deviation from 23.1 to 9.1 index points and the fifth percentile from −41.7 to −13.7 — an 85% reduction in variance — at a lower share-trading cost, because the gamma hedge does some of the work the share hedge was doing.
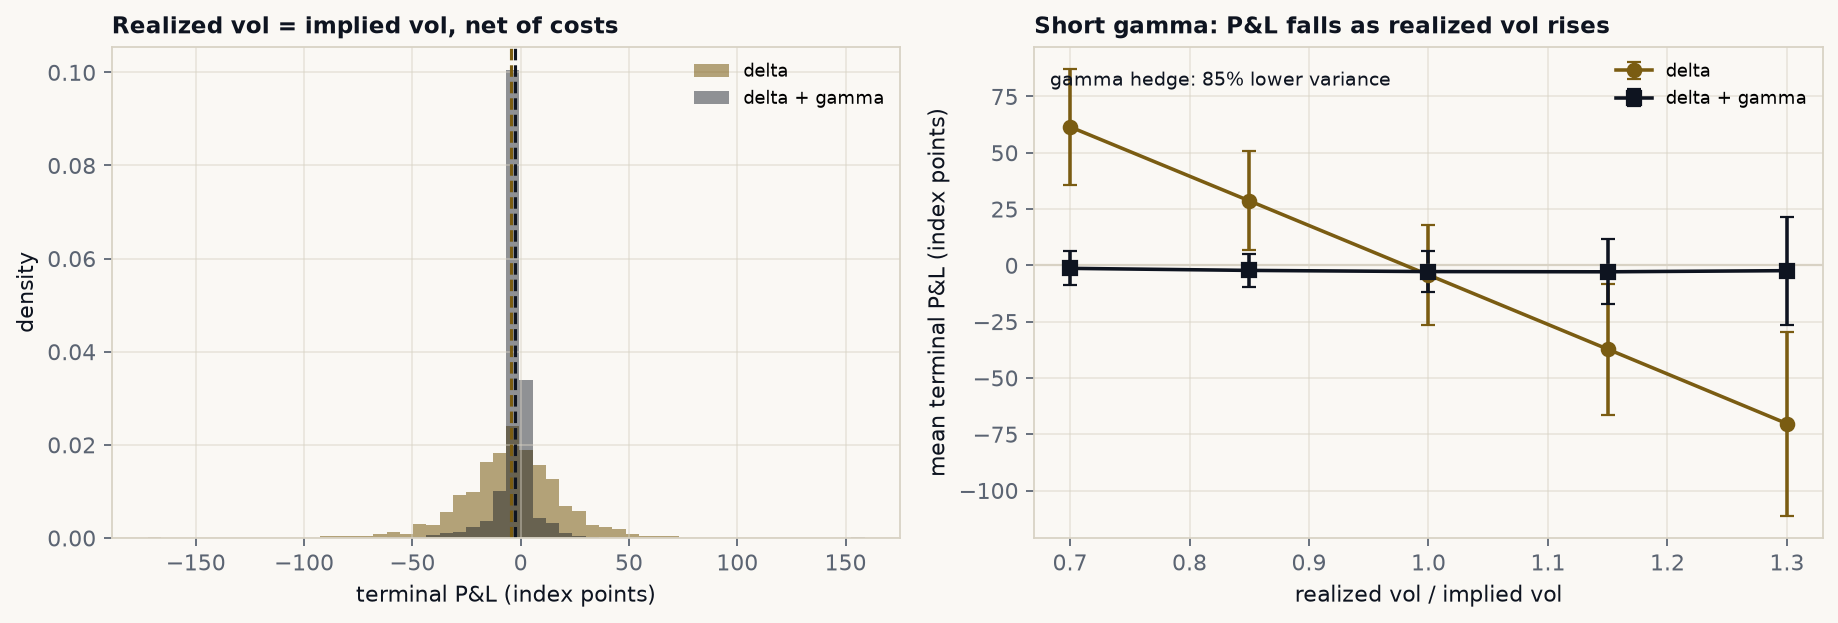
Left: at realized = implied, both books center near zero minus costs, but the gamma-hedged book is much tighter. Right: the delta-hedged P&L falls almost linearly as realized vol rises; the gamma-hedged book is flat. That is what a gamma hedge is for — and what it costs you in upside.
The right panel is the real lesson. From realized/implied = 0.7 to 1.3, the delta-only mean goes from +61.5 to −70.3 index points. The delta-gamma mean stays between −1.3 and −2.9. Delta hedging left a short-gamma position; delta-gamma hedging removed it. It did not remove vega, model risk, or the cost of trading the second option.
A real-data check: selling straddles at VIX
Simulations are clean. Markets are not. As an out-of-sample check, I sold a 21-trading-day ATM SPY straddle every five trading days from October 2023 to October 2026, using the VIX at inception as the implied vol, and delta-hedged it daily with the same fixed IV. At expiry the straddle settles at |S_T − K|. Dividends on the share hedge are credited; trades cost 2 bp. That gives 147 overlapping weekly trades.
| Metric | Value |
|---|---|
| Trades | 147 |
| Mean P&L per straddle | +$594 |
| Mean P&L / premium | +24.5% |
| Mean P&L / spot | +0.77% |
| Standard deviation | $2,450 |
| Hit rate | 60.5% |
| 5th percentile | −$3,997 |
| Worst trade | −$6,573 |
| Best trade | +$7,657 |
| Mean premium | $2,424 |
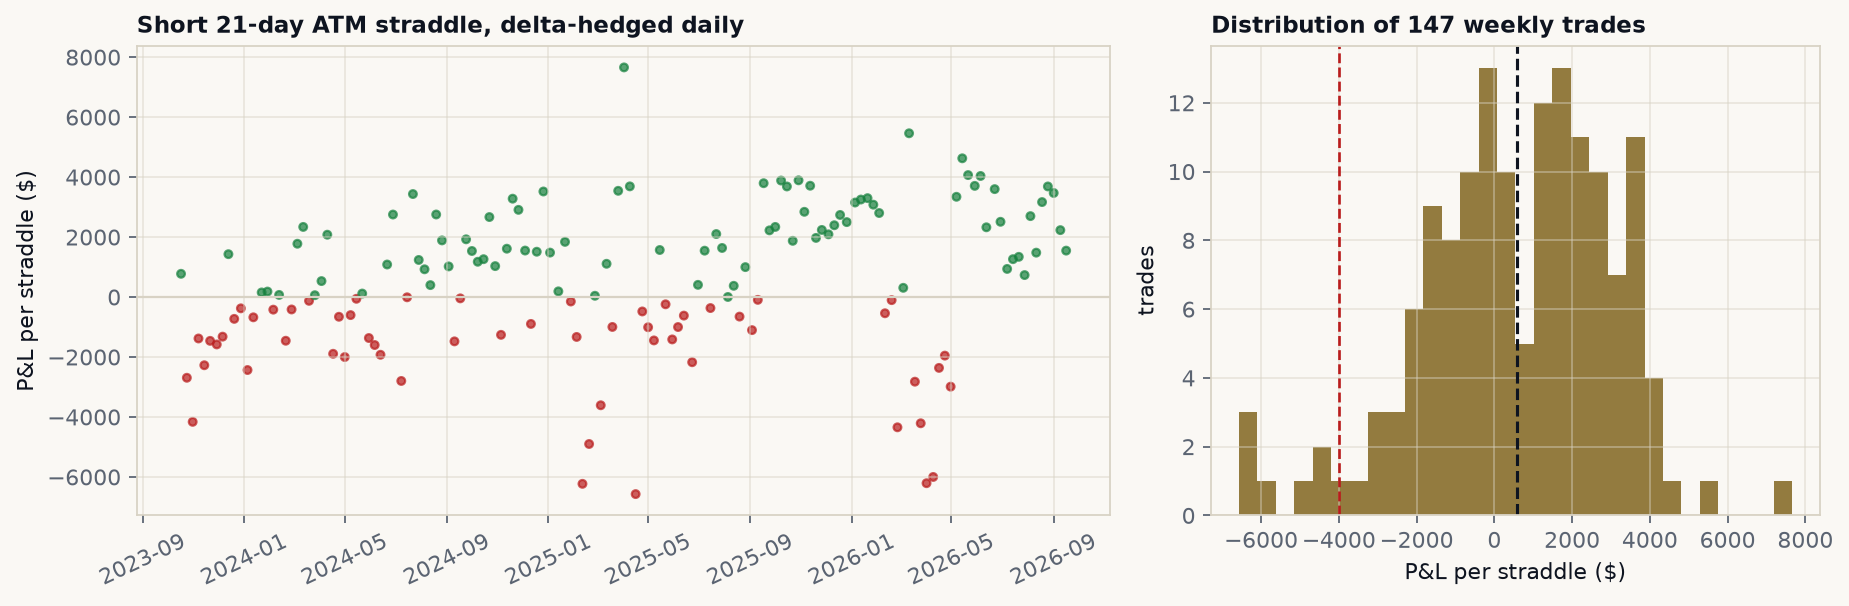
The short-volatility premium was positive in this sample, but the left tail is real: the worst week lost 2.7× the average premium. The windows overlap, so the 147 trades are not 147 independent observations.
This is not a strategy recommendation. It is a sanity check on the simulation: the variance risk premium is visible in real data, the P&L is not arbitrage, and the tail is exactly where a short-gamma book should be afraid. A real book would also hedge vega, mark the position daily, and pay bid-ask on the options, not just the shares.
Casablanca: pricing a put with no options market
The BVC has no listed equity or index options. That does not make option pricing irrelevant; it makes it an OTC problem. A dealer quoting a MASI put has to start somewhere, and the only public input is realized volatility.
Using 3,607 daily MASI closes from March 2012 to October 2026 (the cached series behind the FIN terminal), the realized volatility on 14 October 2026 was:
| Window | Annualized realized vol |
|---|---|
| 21 days | 16.69% |
| 63 days | 13.84% |
| 126 days | 17.73% |
| 252 days | 19.11% |
I price a six-month European put at the 126-day vol (17.73%), a 2.35% MAD rate and no dividend yield. The strike is a percentage of the 16,967.31 spot level.
| Strike | Put price (index pts) | % of notional | Premium on 100M MAD |
|---|---|---|---|
| 90% | 188.96 | 1.11% | 1.11M MAD |
| 95% | 405.46 | 2.39% | 2.39M MAD |
| 100% | 747.70 | 4.41% | 4.41M MAD |
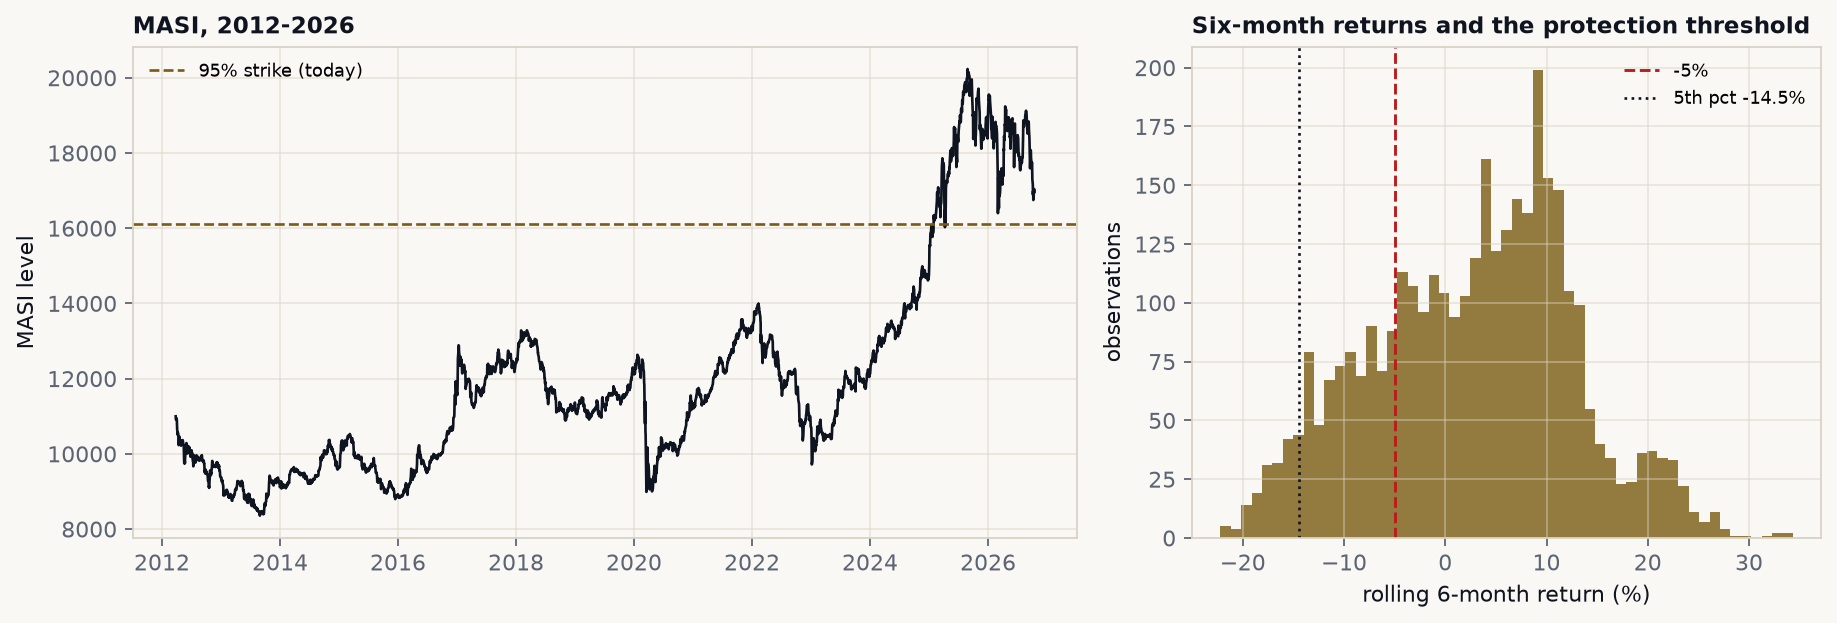
The 95% strike is a 5% decline from today’s level. Since 2012, 23.9% of six-month windows fell more than 5%; the fifth percentile was −14.5%.
The historical check is humbling. The average six-month payoff of a 95% put since 2012 was 1.43% of notional, against a model premium of 2.39%. The 90% put’s historical average payoff was 0.52% against a 1.11% premium. On average, the protection has been expensive; in the tail, it is the only thing that pays. That is what a tail hedge is supposed to look like — and why a dealer would add a spread, funding and capital charge on top of the model price. The 2.39% is a model quote, not an executable one.
Limitations
- Quotes are indicative. CBOE’s delayed quotes are mids, not trades; SPX monthlies are AM-settled and I use calendar-day T to the expiry date. No intraday or settlement-time adjustment.
- The surface is fitted per expiry. SVI has five parameters; one small calendar violation remains, and the 35-day slice needed a butterfly penalty. A production surface would be calibrated jointly with calendar constraints.
- The CBOE IV cross-check is not independent. It uses the same quotes, but a different forward/discount/Black-76 pipeline. A 0.03 vol-point median difference validates the plumbing, not the market.
- The convergence benchmarks are synthetic. The 100-index BSM/binomial/MC comparison is a numerical test, not an SPX trade.
- The hedge simulation is GBM. Constant volatility, no jumps, daily rebalancing, no vega hedge, no borrow, no early exercise, and a flat-vol second option. Real hedging error is fatter-tailed.
- The backtest is small and overlapping. 147 weekly starts are not 147 independent trades; r, q and the initial IV are held fixed; SPY options are American, and the model treats them as European. The sample is one regime, not a forecast.
- The MASI price is a realized-vol quote. There is no listed implied volatility, no options market, and no liquidity benchmark. The data comes from a cached public feed, not a licensed exchange feed.
The point of the lab is not that one model is right. It is that price, surface and hedge are three different objects. The closed form tells you what the option is worth under assumptions; the surface tells you what the market disagrees with; the hedge tells you which of those disagreements you are actually long or short. Delta gets you to zero. Gamma tells you what you still own.
Reproducibility
cd derivatives-lab
python3 derivatives_lab.py selftest
python3 derivatives_lab.py analyze
python3 derivatives_lab.py fetch          # refresh CBOE + Yahoo snapshots
Data: CBOE delayed SPX option chain (_SPX), snapshot value date 16 October 2026; SPY and VIX daily closes from Yahoo Finance; MASI daily closes from the cached FIN series (2012–2026). The cleaned quotes, raw snapshot, hedge trades and MASI prices are written under outputs/; the raw CBOE snapshot is committed gzipped under data/. The engine, data and outputs live in the companion derivatives-lab repository.
Not investment advice. This is a pricing and risk-management exercise on public market data, not a recommendation on any security.
