Table of Contents
- The deal in brief
- Entry: what $55.00 actually buys
- Financing it: a bottom-up build that lands inside the committed envelope
- The operating case New Mountain is actually buying
- Debt paydown: a cash sweep that isn’t what it looks like
- Exit and returns
- The centerpiece: where the return actually comes from
- Sensitivities: what has to move, and by how much
- Downside and Stress: the scenario toggle, not just an exit-multiple flex
- What I make of it
- Where I could be wrong
- Where this goes next
On July 28th, Grant Thornton Advisors — backed by New Mountain Capital — agreed to take CBIZ, Inc. (NYSE: CBZ) private for $55.00 a share, all cash, $5.0 billion of enterprise value. It’s the largest going-private transaction the accounting profession has seen in a generation: a partnership, not a public acquirer, taking a NYSE-listed, $5 billion accounting and advisory platform off the market entirely, funded the way private equity funds everything — with a term loan sized off EBITDA and an equity check sized to make the financing balance.
That’s the tell. There’s no combined-entity EPS to accrete or dilute, because there’s no public acquirer. Grant Thornton Advisors is a private partnership that New Mountain Capital has controlled since May 2024, funding this deal through a parent vehicle with New Mountain Partners VII equity and third-party debt. Strip away the merger-model instinct and what’s left is a much older question: does the sponsor’s return clear its hurdle? That’s a leveraged buyout question, and because the price is already public, it’s not the usual forward-looking exercise of solving for what a sponsor could pay. I held the entry fixed at $55.00 — as-announced — and built everything downstream of it: financing structure, operating case, debt paydown, exit, and a full decomposition of where the equity return actually comes from.
The deal in brief
| Target | CBIZ, Inc. (NYSE: CBZ) — accounting, tax, advisory and benefits/insurance services |
| Buyer | Grant Thornton Advisors, backed by New Mountain Capital |
| Structure | All-cash take-private |
| Offer price | $55.00/share |
| Enterprise value | $5.0 billion |
| Premium to 30-day VWAP | 54.0% |
| Premium to last undisturbed close | 17.8% |
| Committed financing | $5.2 billion (equity + debt, per DEFA14A) |
| Company termination fee | $107.5 million |
| Go-shop period | Through August 27, 2026 |
| Expected close | Q4 2026 |
CBIZ carries this into the deal: $2,758.0 million of FY2025 revenue, $446.9 million of Adjusted EBITDA (16.2% margin), and $1,454.1 million of net debt (mostly the financing left over from CBIZ’s own November 2024 acquisition of Marcum’s non-attest practice). The model below is built entirely from that base — CBIZ’s 10-K, its Q4/FY2025 results, the merger 8-K, and the DEFA14A — with every financing, operating, and exit assumption clearly my own where the filings are silent.
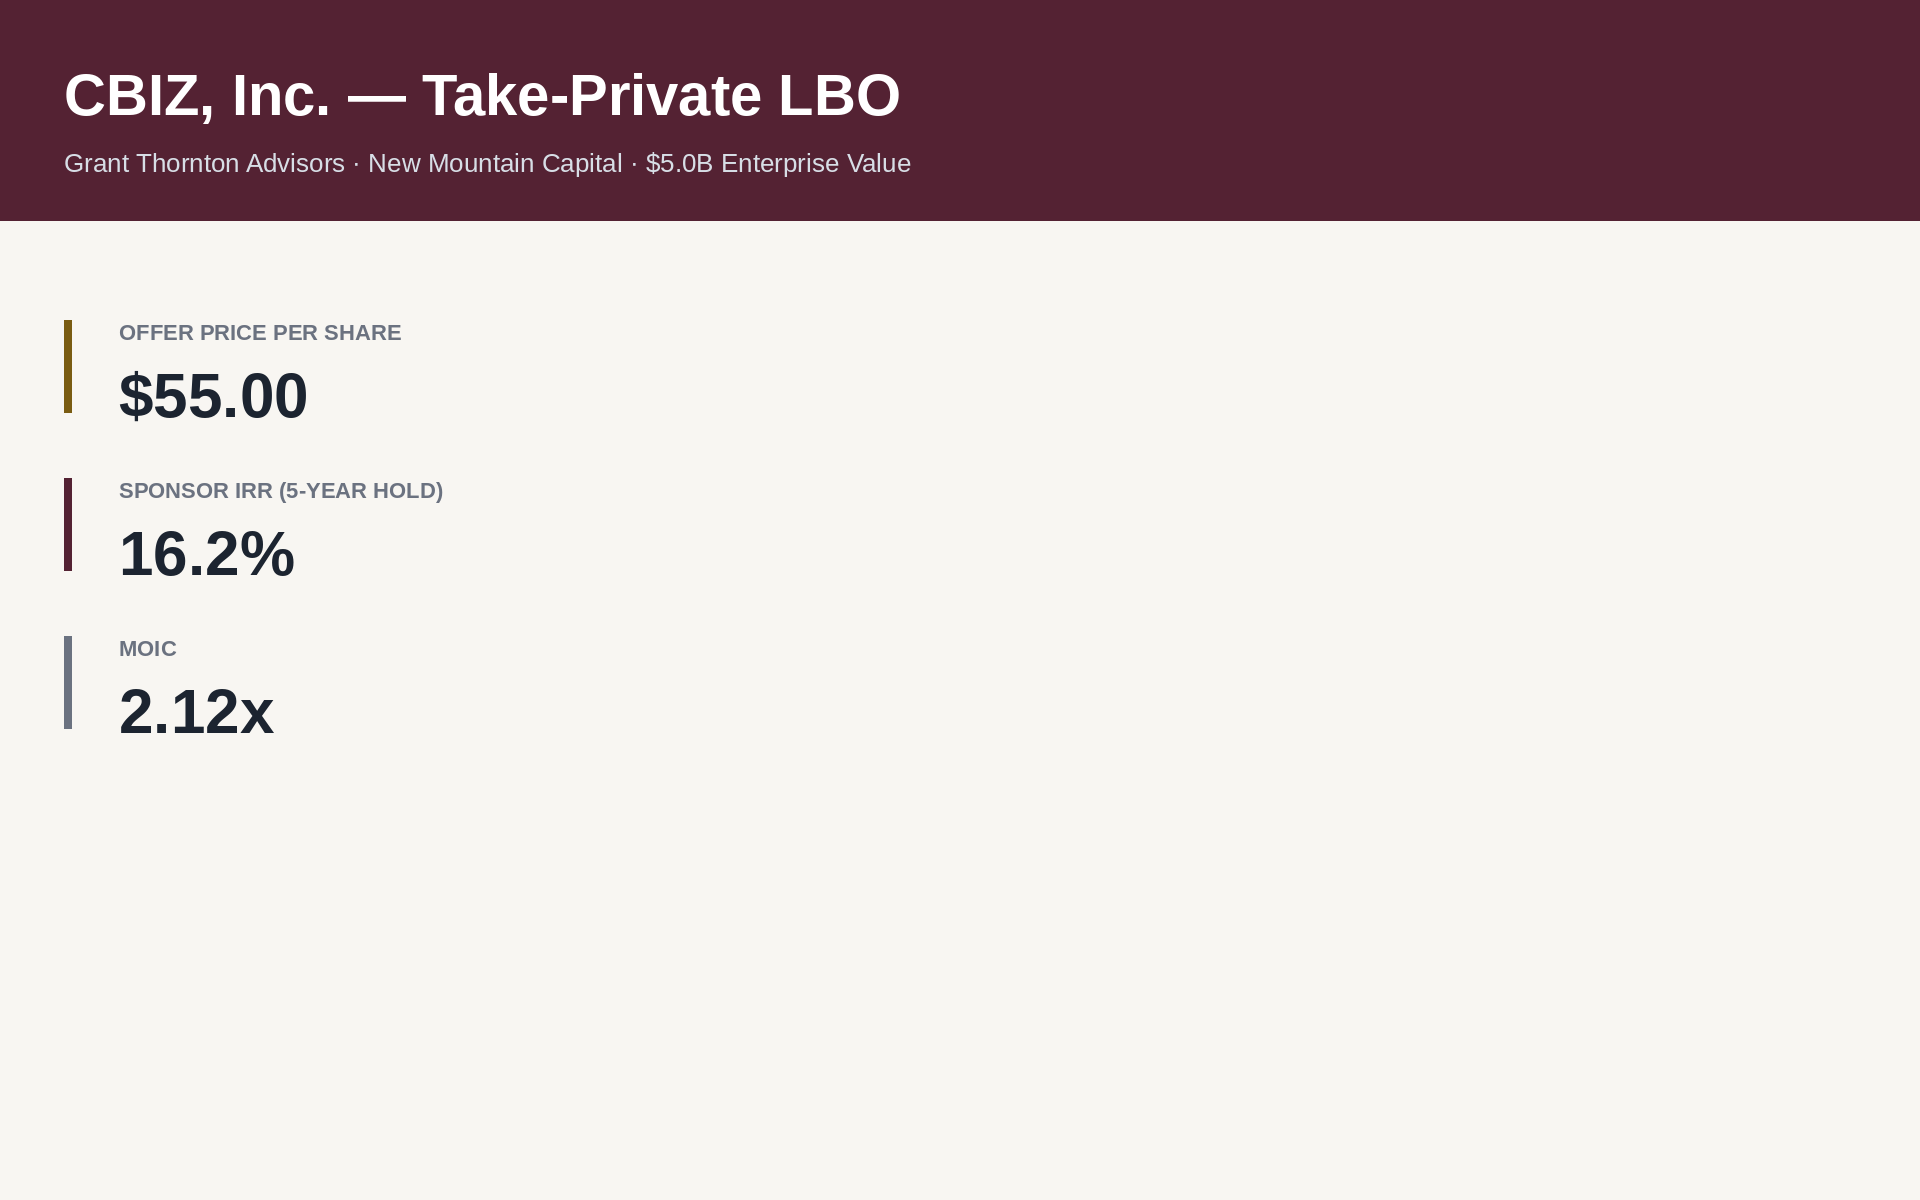
Not in the mood to open a full LBO model yet? This one-page overview covers the deal, the approach, and what the model found — a 2-minute read before the exhibits below.
Entry: what $55.00 actually buys
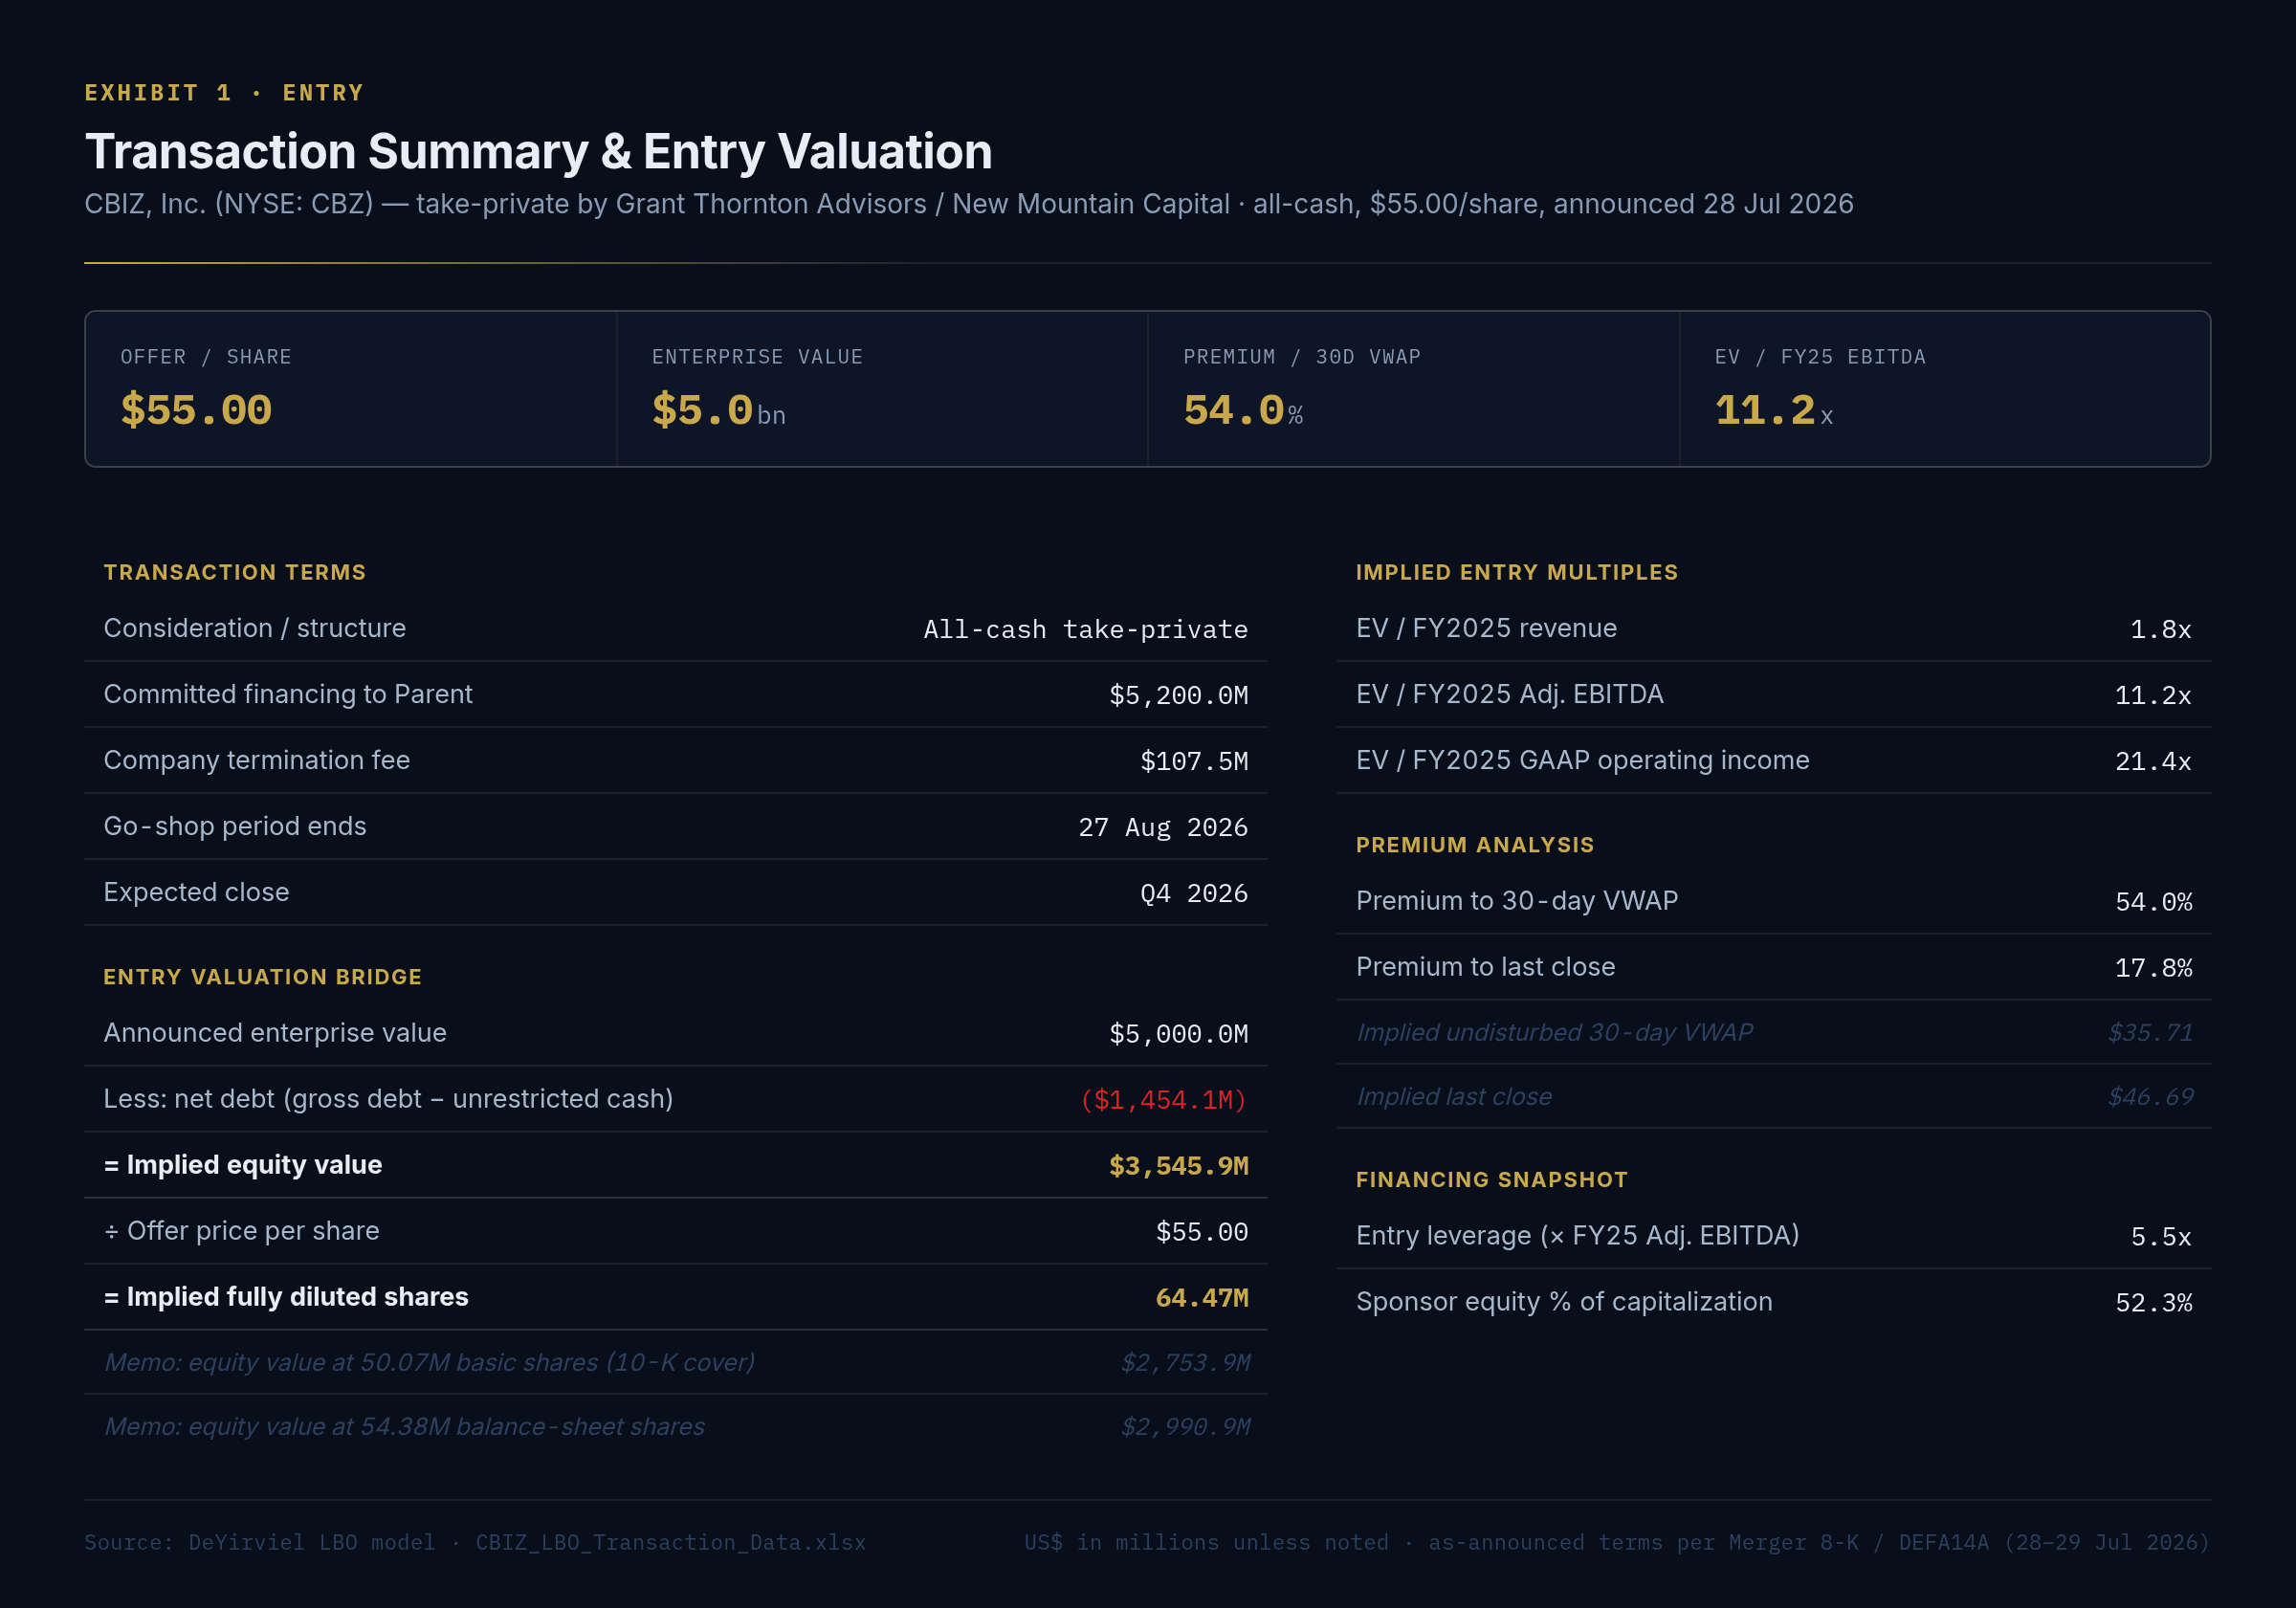
Bridge the announced $5.0 billion enterprise value against $1,454.1 million of net debt and the implied equity value is $3,545.9 million. Divide by $55.00 and you get roughly 64.5 million fully diluted shares — noticeably more than the ~50.1 million basic count on CBIZ’s 10-K cover page, or the ~54.4 million on its balance sheet. The gap is real, and it has a specific cause: CBIZ still owes stock to Marcum’s former partners, delivered monthly over a 36-month schedule tied to the 2024 acquisition. It’s the fully diluted figure — not the headline cover number — that actually reconciles to the deal, and it’s the kind of detail that quietly wrecks a model if you grab the first share count a search engine hands you.
At that share count, CBIZ is being bought for 1.8x FY2025 revenue and 11.2x FY2025 Adjusted EBITDA — full, but not outlandish for a recurring-revenue professional-services platform.
Financing it: a bottom-up build that lands inside the committed envelope
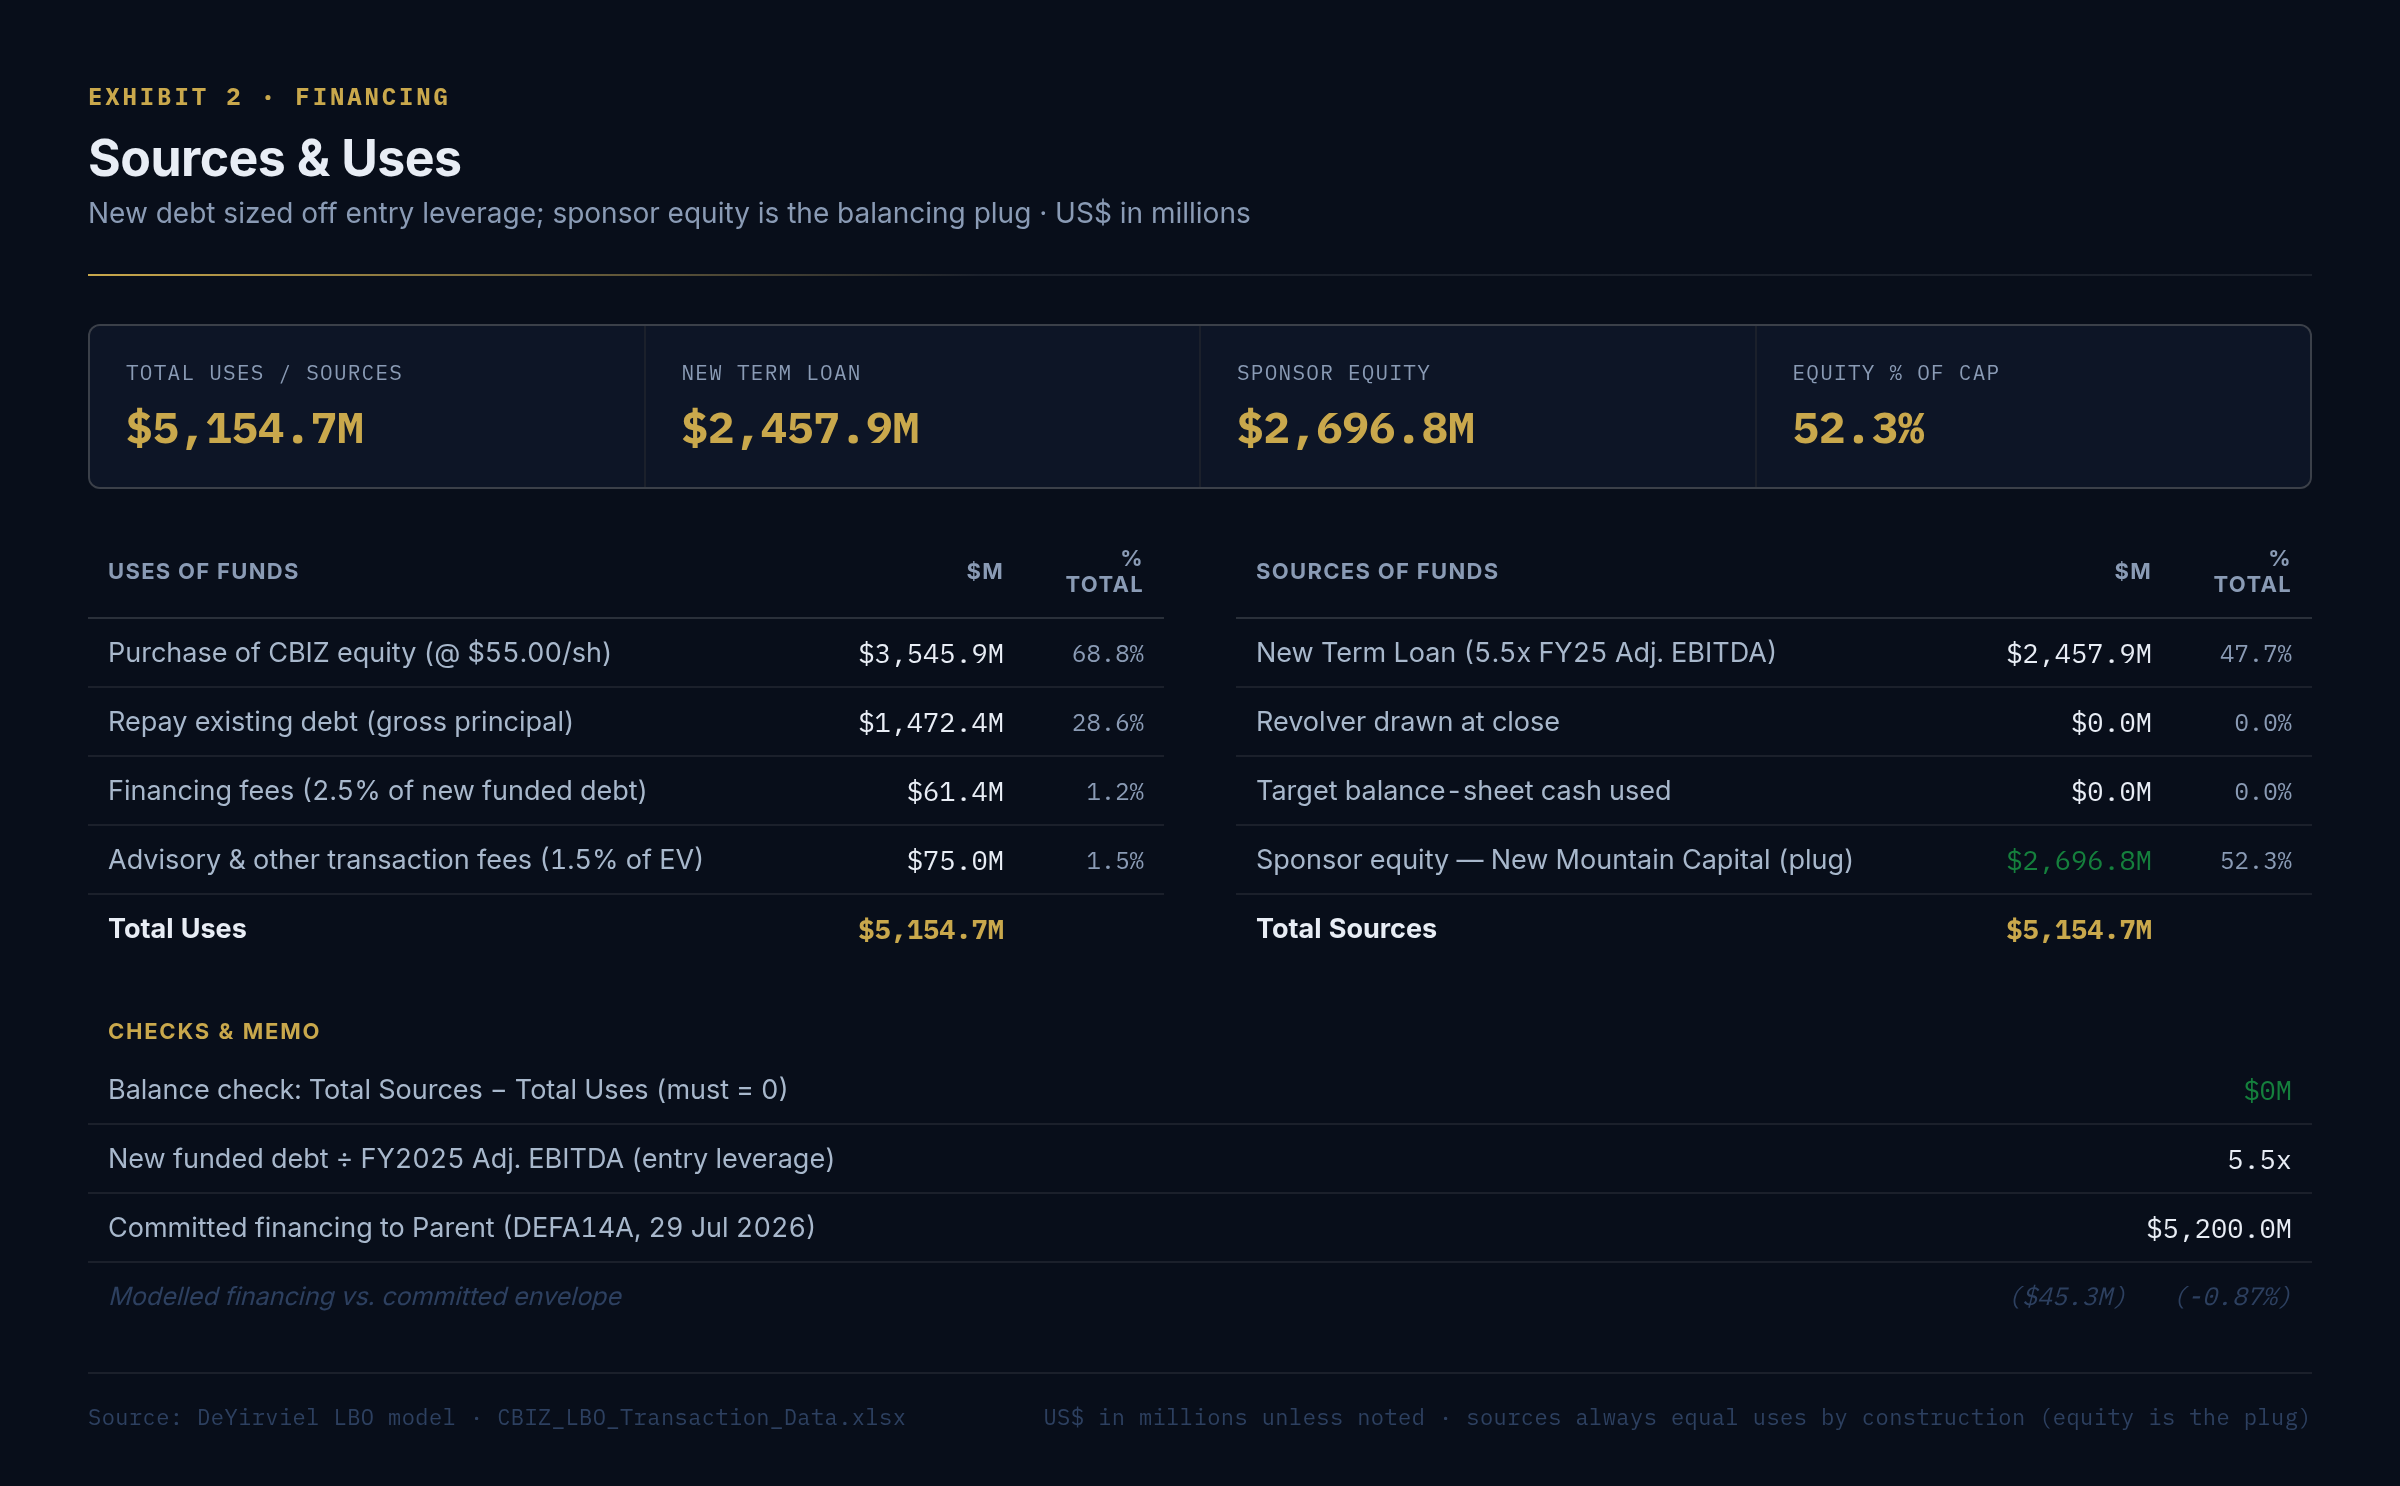
The 8-K discloses $5.2 billion of committed financing without breaking out the split, so I built the capital structure from first principles rather than taking it on faith. At 5.5x FY2025 Adjusted EBITDA — a leverage assumption I calibrated to 2024–2026 sponsor-deal averages in the leveraged-loan market, not a disclosed number — the new Term Loan B comes to $2,458.0 million. Layer on financing fees (2.5% of new funded debt) and advisory fees (1.5% of EV), and total uses come to $5,154.7 million. New Mountain’s sponsor equity check is the plug that makes sources equal uses: $2,696.8 million, or 52.3% of the capital structure.
Total modeled financing comes to $5,154.7 million against the $5.2 billion actually committed — within 0.87%. That’s not proof the leverage assumption is correct; I built the structure without seeing the commitment letters. But a bottom-up build landing inside 1% of a disclosed number I never touched is a decent sanity check.
The Term Loan B prices at SOFR (4.00%) plus a 450 basis-point spread — 8.50% all-in — benchmarked to actual early-2026 B-rated vintage deals rather than disclosed terms. That’s a real cost: across the hold, total cash interest on this structure comes to roughly $796.8 million.
The operating case New Mountain is actually buying
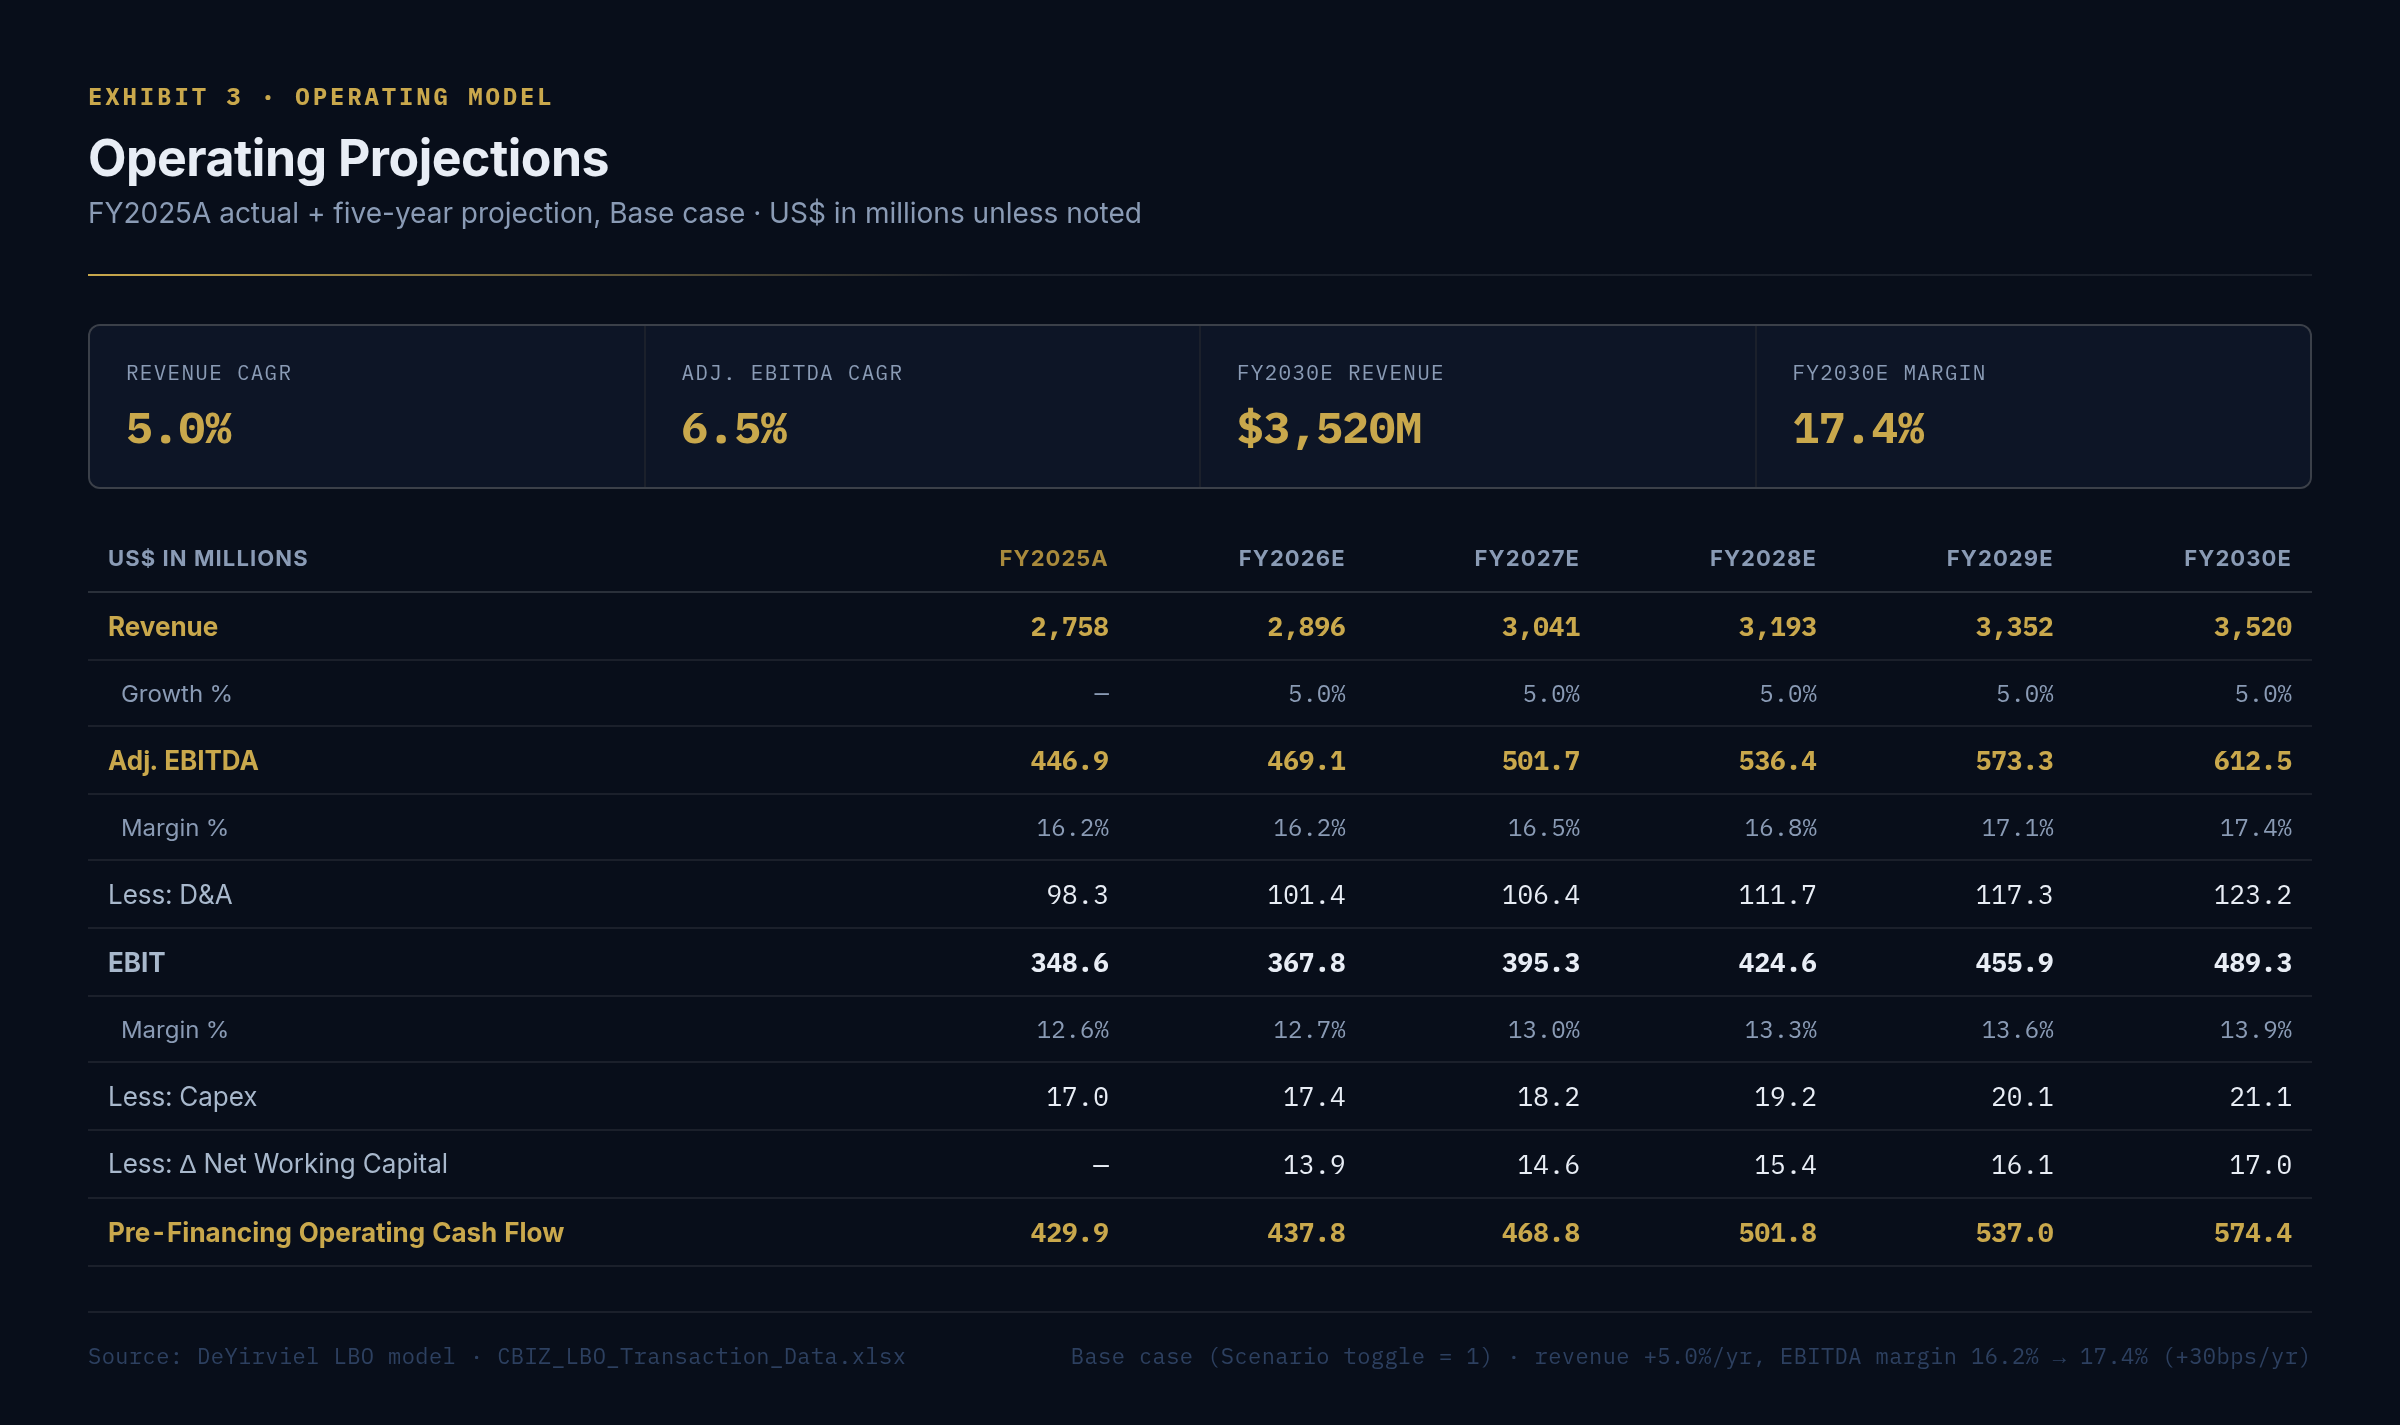
I modeled 5% annual organic revenue growth — no bolt-on M&A, deliberately, since that’s exactly the kind of upside a sponsor would want to keep separate from a base case rather than bake in. Revenue goes from $2,758.0 million to $3,520.0 million by FY2030. Adjusted EBITDA margin expands from 16.2% to 17.4% — 120 basis points over five years — pushing EBITDA to $612.5 million, an EBITDA CAGR of 6.5% that outgrows revenue on margin alone.
That margin ramp is New Mountain’s efficiency thesis, expressed as a spreadsheet: finishing the Marcum integration, offshoring back-office functions, AI-assisted workflow tools. It’s a believable, not heroic, read on that playbook — and it’s the only lever driving EBITDA growth here, since I held revenue growth flat and excluded acquisitive upside entirely. Working capital is built bottom-up off CBIZ’s actual FY2025 balance sheet (receivables on a 73.6-day DSO, payables and accrued personnel as a share of revenue) rather than an assumed percentage of revenue growth — it implies 10.1% of incremental revenue, a more conservative (and better-sourced) figure than the simpler plug it replaced.
Debt paydown: a cash sweep that isn’t what it looks like
Here’s where this model earns its complexity. The Term Loan carries 1.0% scheduled amortization on original principal — a flat $24.6 million a year — plus a cash sweep that is not a flat 100%. It’s a leverage-based step-down, re-tested every year against that year’s opening net leverage: 50% of excess free cash flow is swept above 4.50x, 25% between 3.50x and 4.50x, and 0% below 3.50x. CBIZ enters at 5.46x net leverage, so the sweep runs hot early and shuts off almost entirely by FY2030E, when opening leverage has already fallen below 3.5x.
The consequence is not obvious from the entry-to-exit leverage numbers alone. Net leverage still de-levers cleanly, from 5.5x gross at entry to 2.37x at exit — but cumulative Term Loan paydown over the whole hold is only $292.4 million of the $2,458.0 million original principal. The rest of the deleveraging happens because cash builds up on the balance sheet — from $18.3 million retained at close to $715.3 million by FY2030E — not because the loan gets smaller. Gross debt, and therefore cash interest, stays higher for longer than a “100% sweep” story would suggest. It’s a more realistic mechanic than a flat sweep (real credit agreements almost always step down like this), but it means the headline deleveraging number is doing less work than it looks like.
Two more things this schedule gets right that a simpler model wouldn’t: cash interest is charged on the average of opening and closing balance (a deliberate circularity — closing balance depends on the sweep, the sweep depends on free cash flow, free cash flow depends on this interest line — resolved by Excel’s iterative calculation rather than sidestepped by charging interest on the opening balance alone; there’s a breaker switch that reverts to opening-balance interest if the iteration ever needs to be reset after a bad paste or a deleted row). And the growing cash balance isn’t just sitting there: it earns interest income at SOFR less a 50bp deposit spread, which feeds back into the §163(j) test below — business interest income raises the deduction cap dollar-for-dollar, so for as long as the cap binds, interest earned on the cash pile is effectively untaxed. By FY2030E that interest income offsets almost 11% of the year’s cash interest expense.
Cash taxes themselves are computed on §163(j)-limited taxable income, not book pre-tax income — the U.S. business-interest deduction caps at 30% of adjusted taxable income (≈EBIT, no D&A add-back post-2022), with disallowed interest carried forward indefinitely. On a 5.5x-levered structure, that cap binds every year of the hold, so a meaningful share of the cash interest actually paid earns no current tax shield at all; by FY2030E the disallowed-interest carryforward has built to $222.1 million, a tax attribute that transfers with the company at exit and isn’t valued anywhere in this model’s returns.
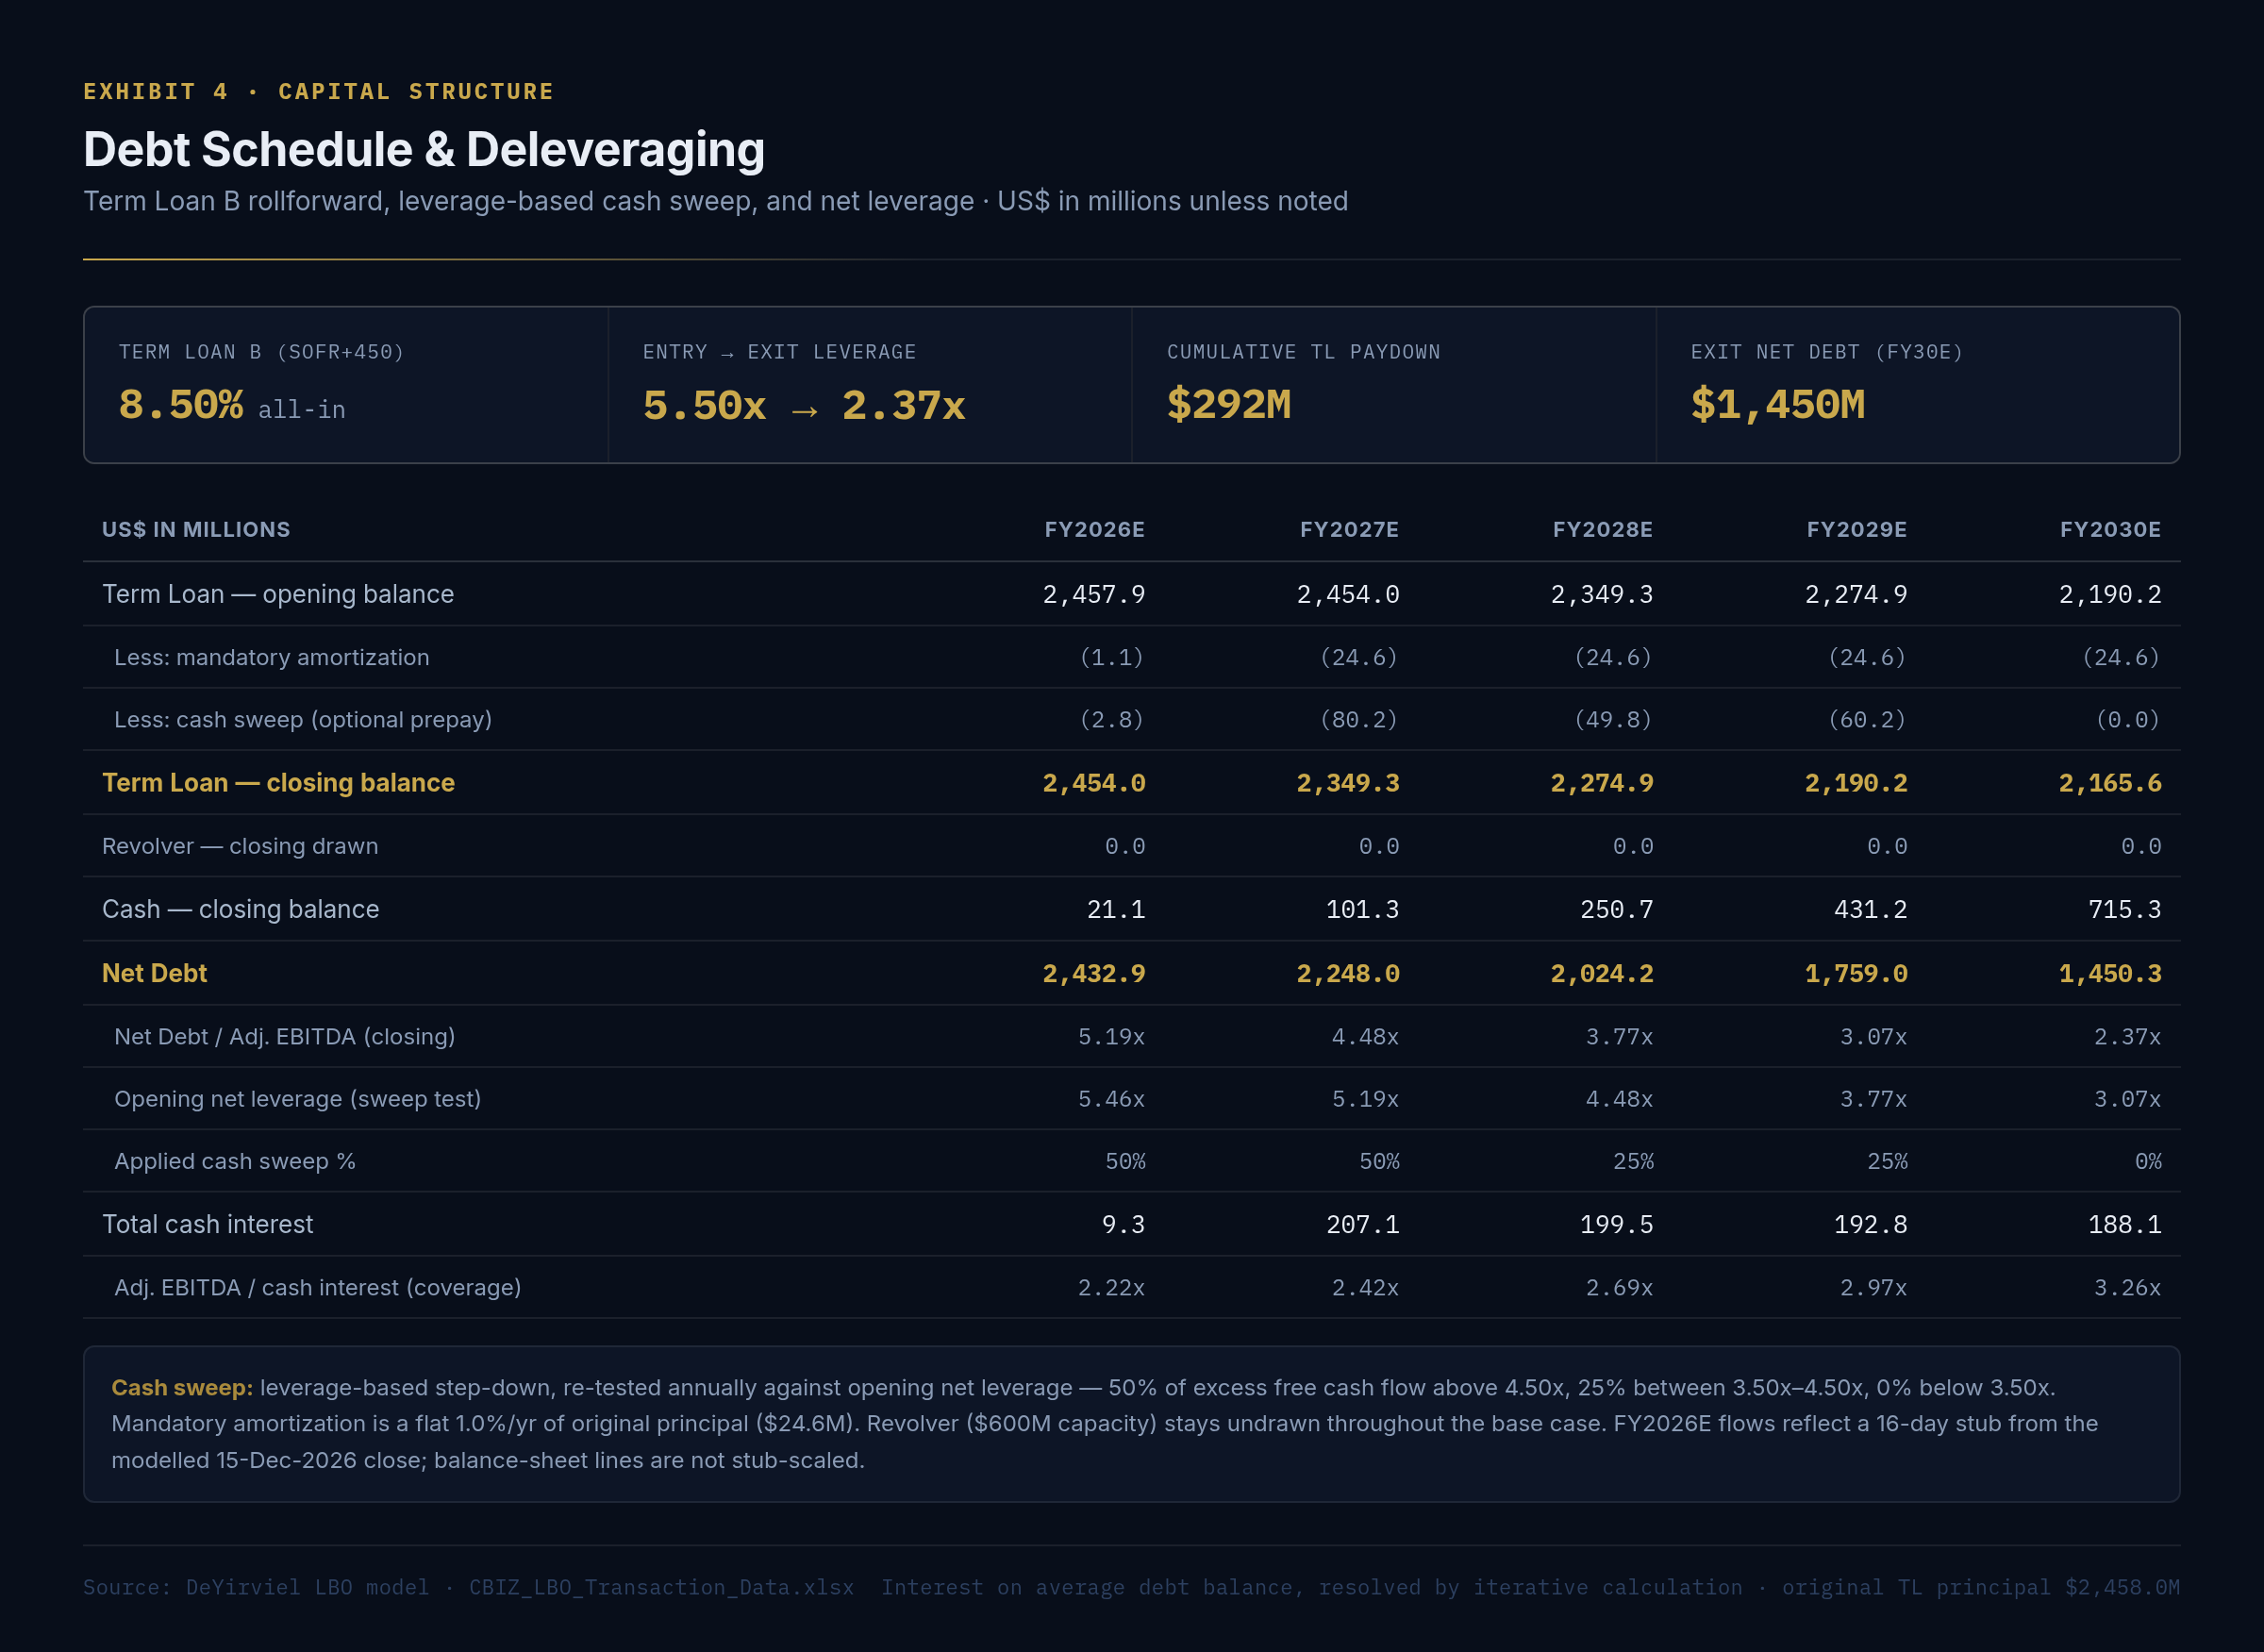
One more mechanical point worth flagging because it changes the IRR math: the model assumes the sponsor’s equity funds on December 15, 2026 — a 16-day stub in FY2026E — against a FY2030E fiscal-year-end exit. That’s a 4.05-year calendar hold, not five fiscal years. Every flow in the stub year is scaled to the 16 days actually owned; the headline IRR (MOIC^(1/hold) − 1) and a dated XIRR on the actual cash flows reconcile to the same number to the fourth decimal. It’s a small thing, but crediting a sponsor with a full first year of deleveraging it didn’t own would flatter the IRR by a meaningful margin.
Exit and returns
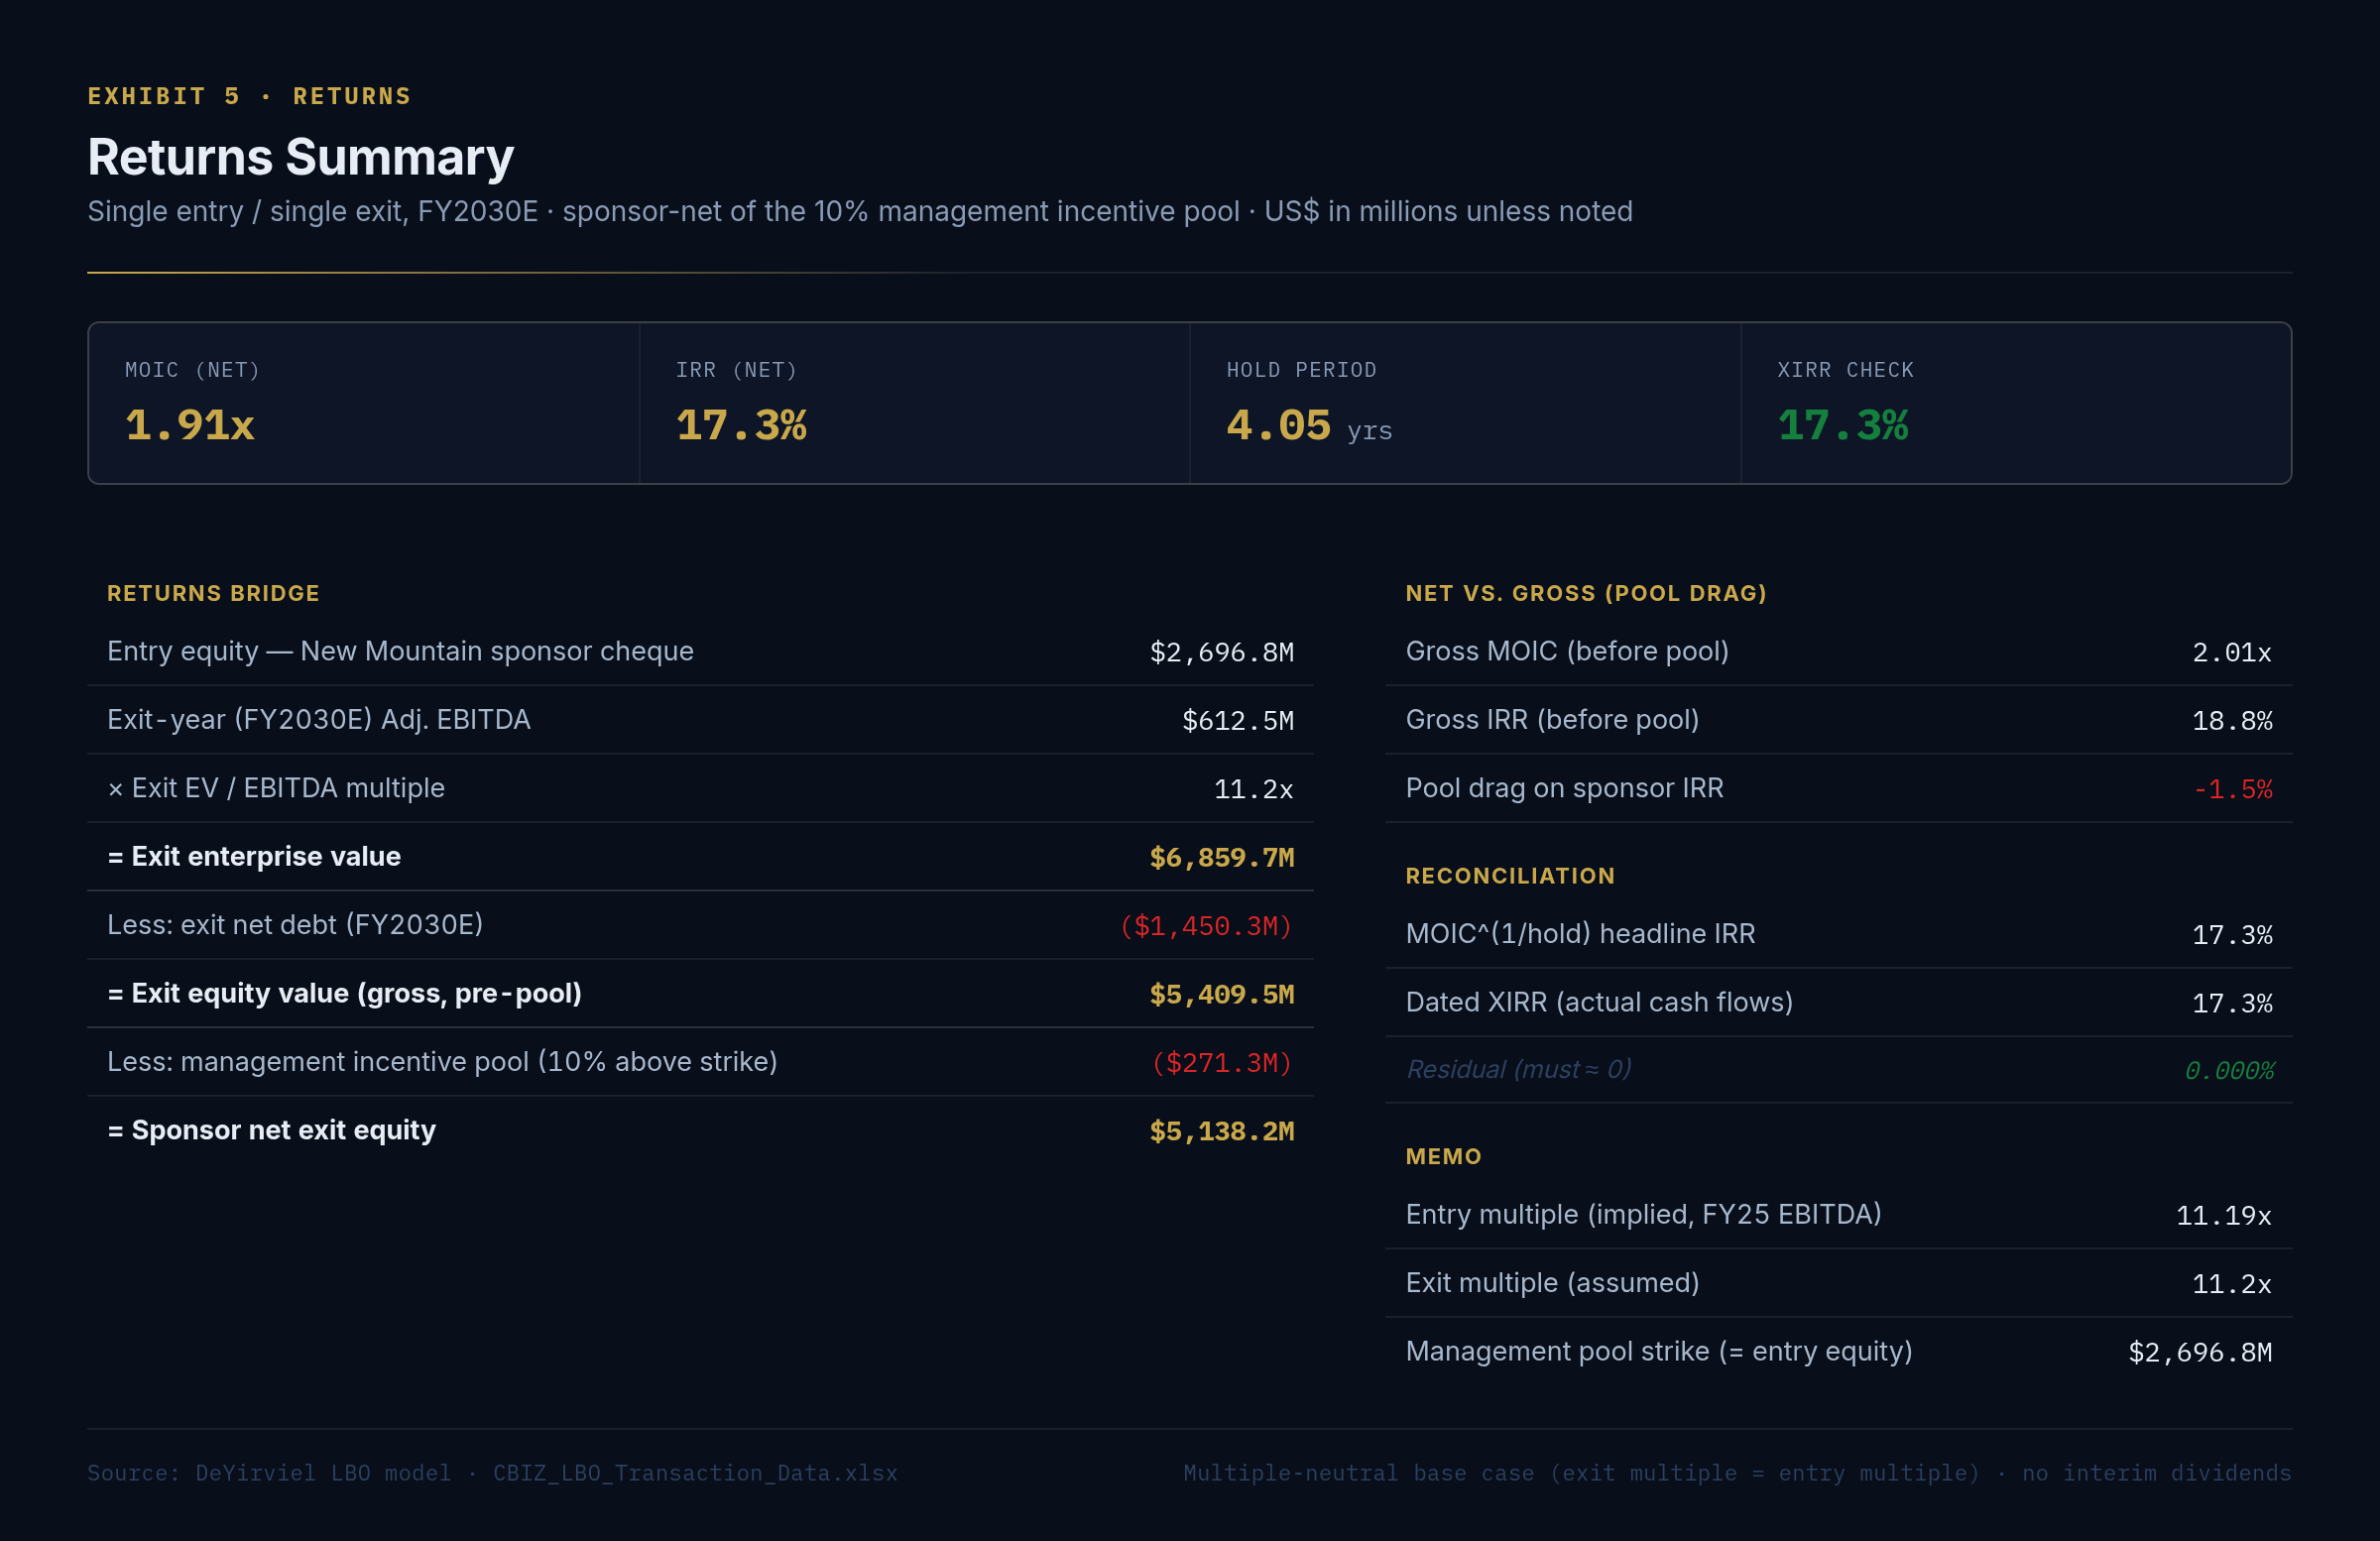
Exit is modeled multiple-neutral — 11.2x FY2030E Adjusted EBITDA, the same multiple CBIZ is being bought at, so nothing here assumes a friendlier buyer shows up later. That’s $6,859.7 million of exit enterprise value on $612.5 million of exit EBITDA. Less $1,450.3 million of exit net debt, gross exit equity is $5,409.5 million.
The sponsor doesn’t keep all of that. I modeled a 10% management incentive pool — appreciation-only, paid on value created above the sponsor’s entry cheque — which is a realistic feature of how these deals actually get structured, not a disclosed term. It takes $271.3 million, leaving sponsor-net exit equity of $5,138.2 million.
Against the $2,696.8 million entry cheque: 1.91x MOIC, 17.3% net IRR. Before the management pool, gross MOIC is 2.01x and gross IRR is 18.8% — the pool costs the sponsor about 1.5 points of IRR.
The centerpiece: where the return actually comes from
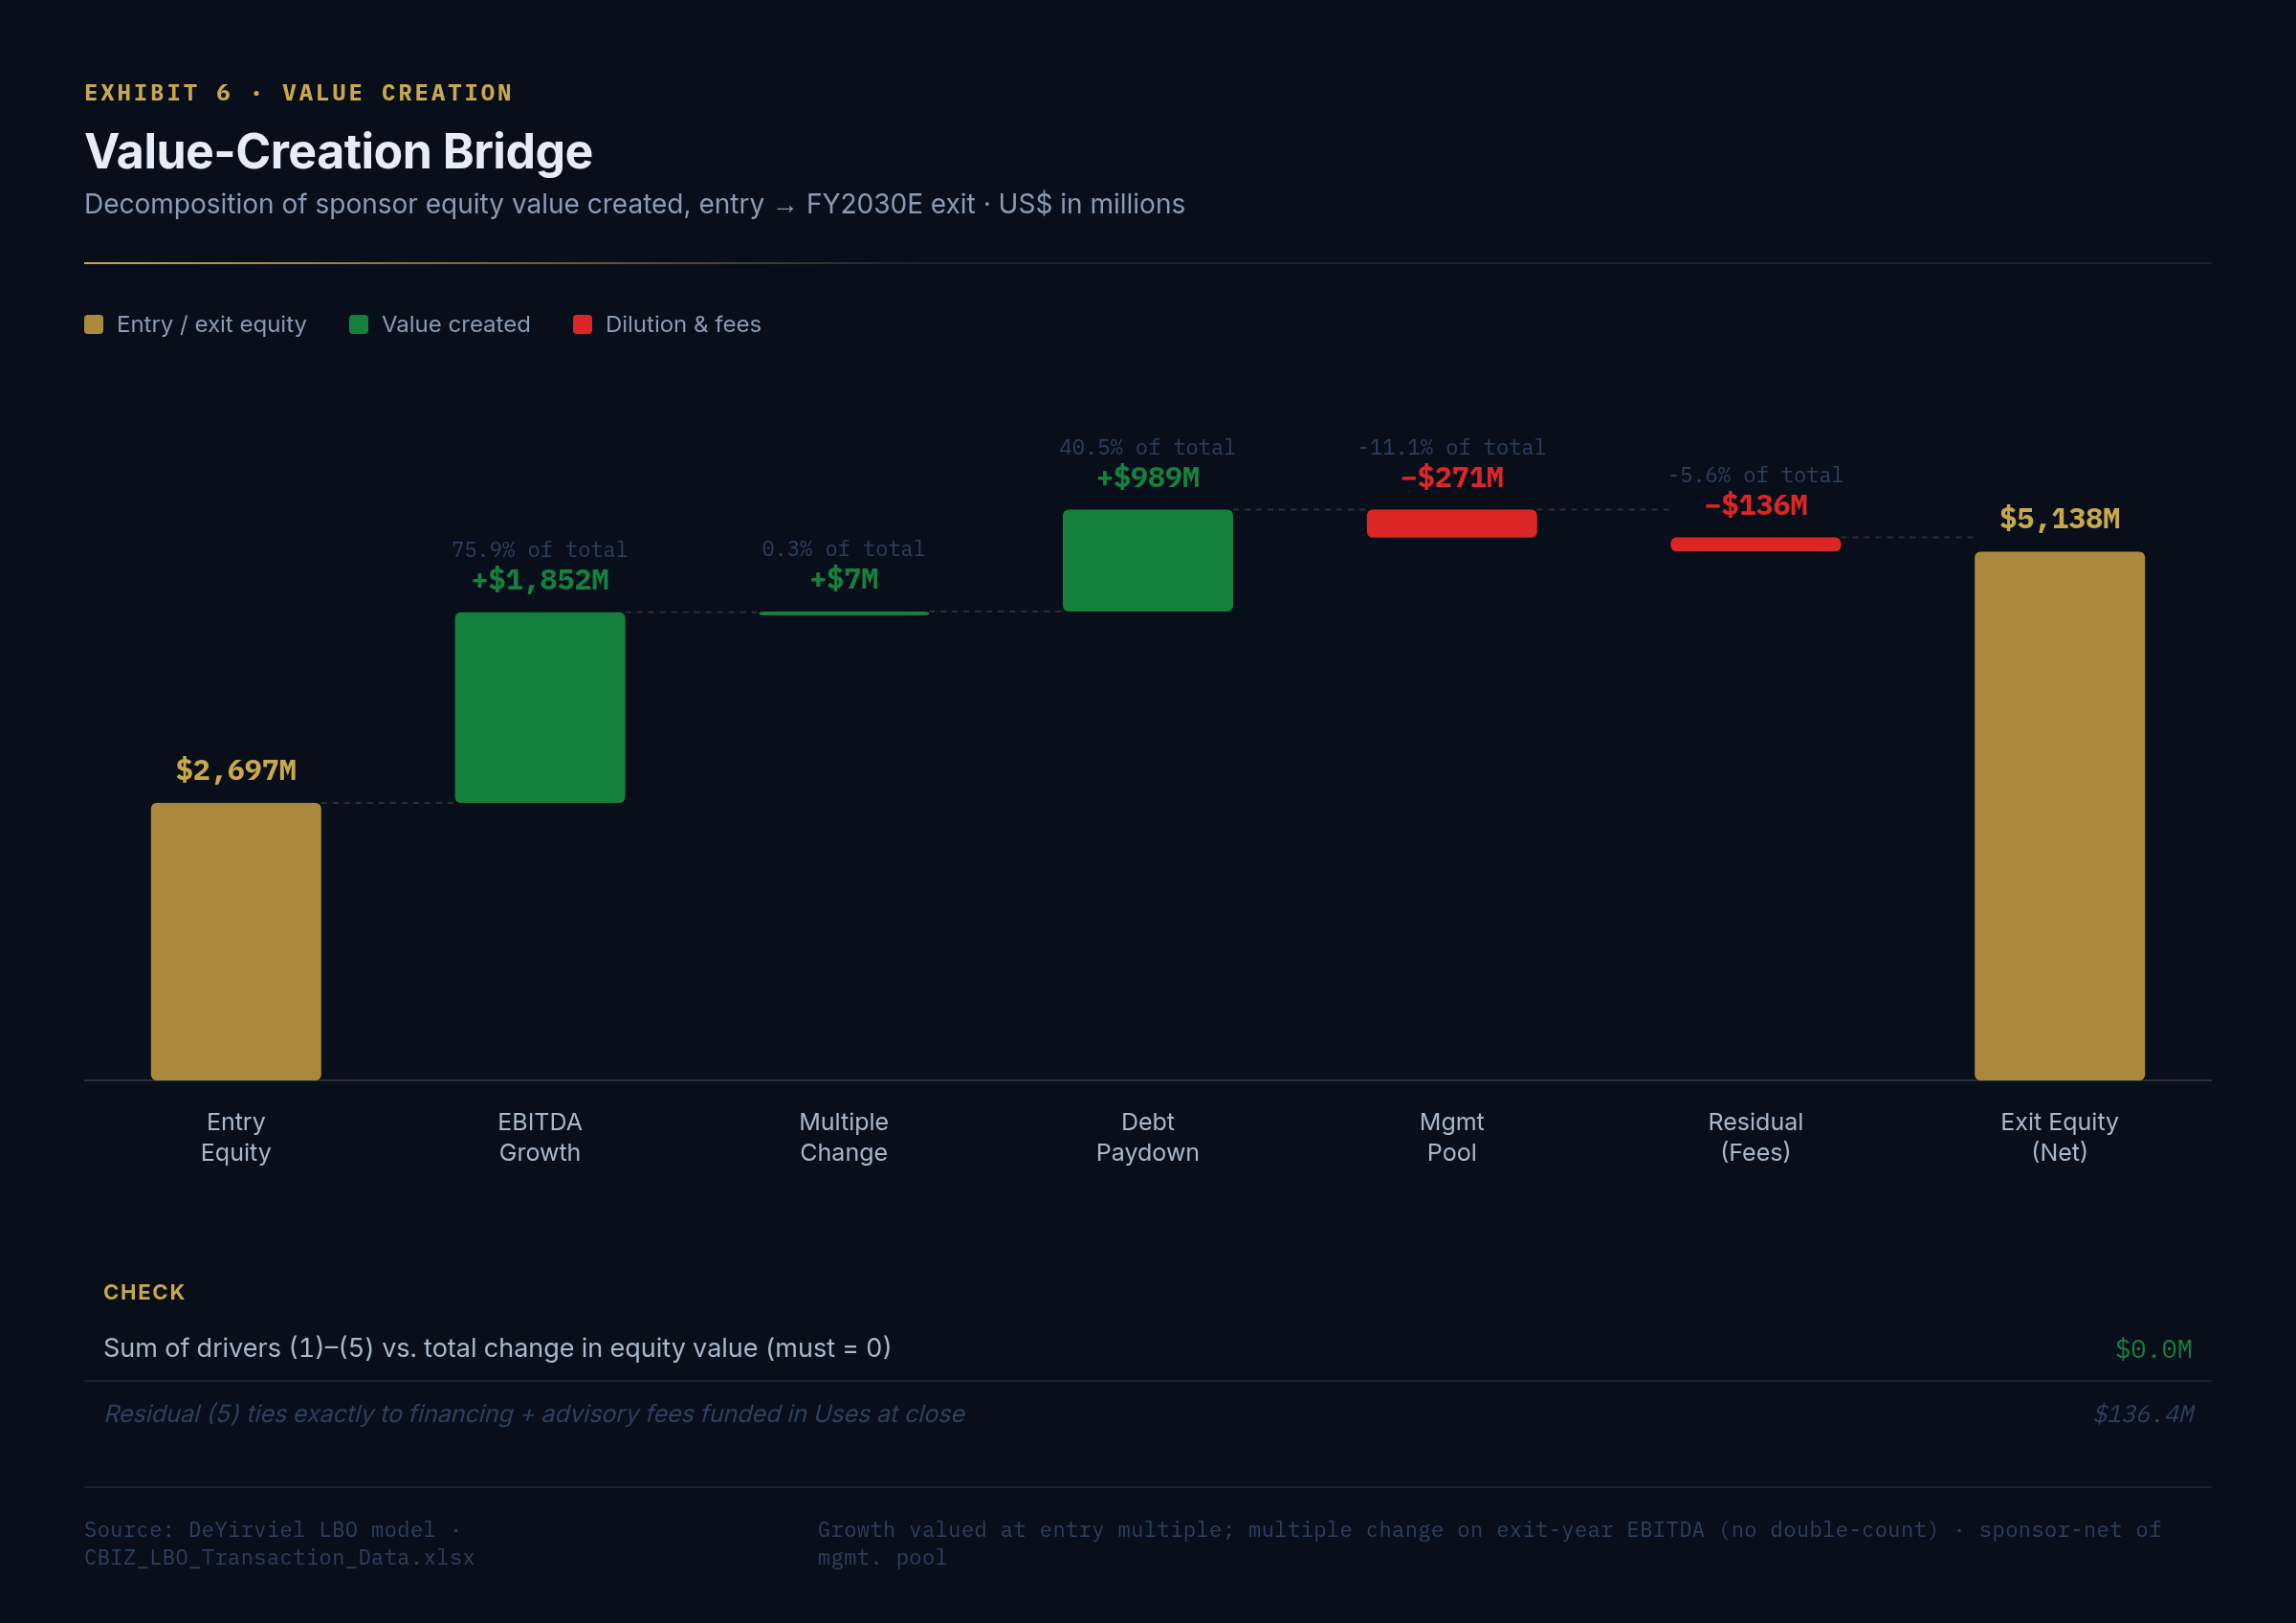
This is the number that matters more than the IRR itself. Decompose the $2,441.4 million of sponsor equity value created and it isn’t close:
| Driver | $ millions | % of total |
|---|---|---|
| EBITDA growth (at entry multiple) | +1,852.5 | 75.9% |
| Multiple change | +7.2 | 0.3% |
| Debt paydown / deleveraging | +989.4 | 40.5% |
| Management incentive pool | (271.3) | (11.1%) |
| Residual — transaction & financing fees | (136.4) | (5.6%) |
| Total | 2,441.4 | 100% |
Three-quarters of the return is organic EBITDA growth, valued at the entry multiple so it isn’t quietly co-mingled with any re-rating. Another 40% comes from deleveraging — which, per the debt schedule above, is mostly a growing cash balance rather than a shrinking loan. Multiple expansion contributes almost nothing, by design: the exit is multiple-neutral. That’s a specific, checkable claim, not a hand-wave — the fee bucket alone (financing fees plus advisory fees funded in Uses at close) accounts for the entire residual, to the dollar.
What’s not in this bridge: the Benefits & Insurance carve-out that’s part of the actual announced transaction. CBIZ’s Benefits & Insurance segment does not appear anywhere in this model — not as a revenue line item split out, not as a divestiture, not as a source of proceeds. I built the operating case as if the sponsor owns and grows all of CBIZ through FY2030E. That cuts both ways, and I’ve split the two directions apart rather than blending them: it means a potential value-creation lever (carve-out proceeds) is missing from the upside case, discussed below — and it means the leverage and coverage figures earlier in this piece are almost certainly flattered, which is the first item in “Where I could be wrong.”
Sensitivities: what has to move, and by how much
Hold the operating case fixed and flex exit multiple against exit-year EBITDA, and the base case sits almost exactly in the middle of a realistic range — 6.7% IRR in the worst corner (9.2x exit, -10% EBITDA) to 26.5% in the best (13.2x exit, +10% EBITDA).
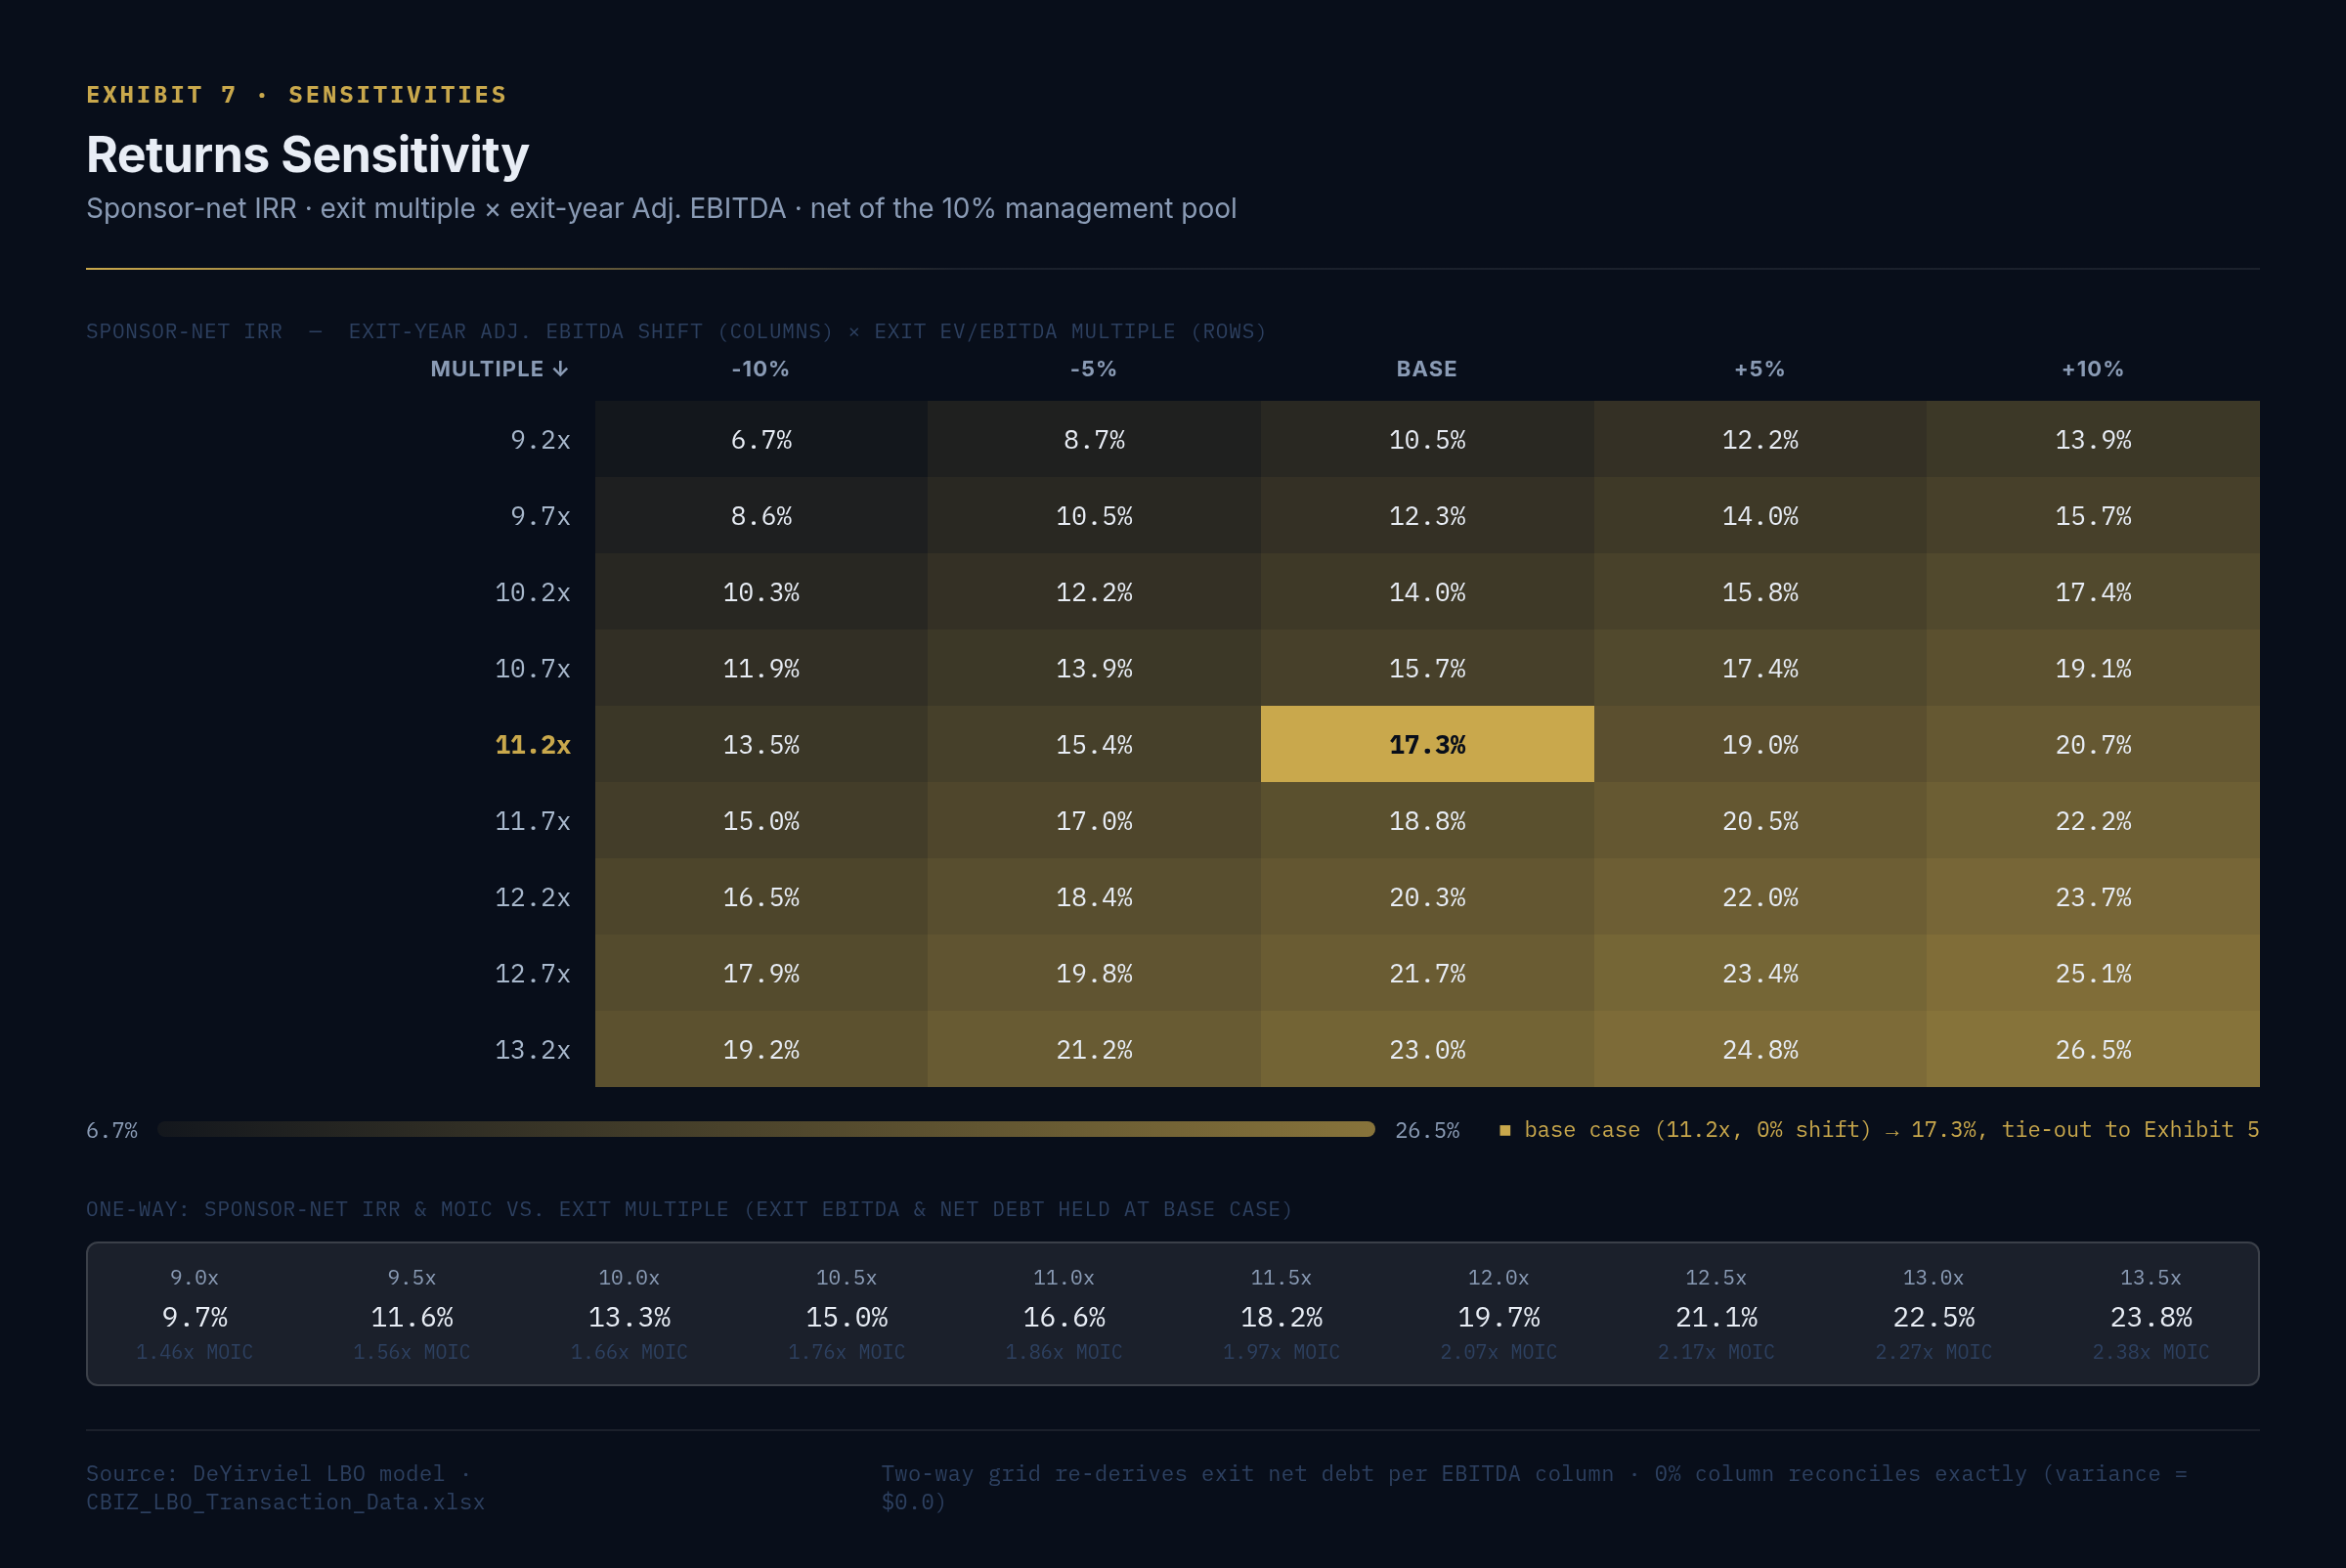
Solved the other way — what exit multiple does New Mountain need for a given target IRR, holding the base operating case — the picture is specific: clearing 15% needs 10.5x, actually below the 11.2x entry. Clearing 20%, closer to a standard platform-deal hurdle, needs about 12.1x — roughly nine-tenths of a turn above entry. Clearing 25% needs about 13.9x, over two and a half turns of expansion. The floor — where the sponsor merely gets its money back, 1.0x MOIC — is 6.8x, a level that would require the kind of collapse professional-services multiples haven’t seen in this cycle.
One mechanical note on that grid, because it’s the kind of thing that’s easy to fake and worth checking: each EBITDA column re-derives its own exit net debt rather than holding it fixed at the base case. A -10% EBITDA column doesn’t just shrink the exit-equity numerator — it also scales down the cumulative cash sweep for that column (less free cash flow means less optional prepayment), so exit net debt in the worst corner is genuinely higher than in the base case, not held artificially low while only the multiple and EBITDA move.
Downside and Stress: the scenario toggle, not just an exit-multiple flex
Everything above is the base case — 5% annual revenue growth, margin expanding to 17.4% by FY2030E. The model doesn’t only run that one case: there’s a scenario toggle that swaps in an entirely different revenue and margin path, which cascades through the debt schedule (a different EBITDA path changes the leverage-sweep tier tested every year) and into the returns bridge, rather than just flexing the exit multiple around a fixed operating case the way the sensitivity grid above does.
Downside holds revenue growth to 3% a year with margin flat at the FY2025A 16.2% — the read being that Marcum synergies fail to drop through and 3% growth doesn’t generate enough operating leverage to move the margin at all. Stress is harsher and asymmetric: revenue declines 3% in FY2026E — client attrition, lost advisory mandates — and never recovers, held flat through FY2030E, while margin compresses in a straight line from 16.2% to 14.0% on pricing pressure and negative operating leverage over a shrinking base.
I ran both through the same debt schedule and returns bridge as the base case — same $55.00 entry, same 5.5x leverage, same 11.2x exit multiple, same 4.05-year hold, same 10% management pool:
| Base | Downside | Stress | |
|---|---|---|---|
| Revenue growth (FY2026E) | 5.0% | 3.0% | (3.0%) |
| FY2030E Adj. EBITDA | $612.5M | $518.0M | $374.5M |
| FY2030E Adj. EBITDA CAGR | 6.5% | 3.0% | (3.5%) |
| Exit net leverage | 2.37x | 3.13x | 5.15x |
| Cumulative Term Loan paydown | $292.4M | $357.6M | $304.6M |
| MOIC (sponsor net) | 1.91x | 1.49x | 0.84x |
| IRR (sponsor net) | 17.3% | 10.4% | (4.2%) |
Downside still clears a real, positive return — 10.4% net isn’t 17.3%, but it’s not a loss, and it doesn’t require anything to go badly wrong, just softer growth with no margin capture. Stress is where the deal actually breaks: EBITDA shrinks in nominal dollars from $446.9 million to $374.5 million, and because EBITDA falls roughly as fast as debt gets paid down, opening net leverage never drops out of the top sweep tier — the leverage-based step-down never actually steps down in this case, and the sweep runs at 50% every single year of the hold, which still isn’t enough to outrun a shrinking EBITDA base. Exit net leverage lands at 5.15x, barely below the 5.46x the deal entered at. The sponsor loses money in nominal terms: 0.84x MOIC, a small negative IRR. One honest wrinkle worth naming: in Stress, the management incentive pool costs the sponsor nothing at all, because exit equity never clears the strike (the entry cheque) — gross and net returns are identical. An appreciation-only pool has no downside cost; it’s asymmetric by construction, which is exactly the point of structuring it that way.
What I make of it
Three things stand out once the model is built, and they don’t all point the same direction.
The return composition is unusually clean for a sponsor deal, and that’s both the strength and the ceiling. Most buyout returns lean on some combination of leverage, multiple arbitrage, and operating improvement. Here, multiple arbitrage is explicitly zero — the model doesn’t assume CBIZ gets a richer multiple on the way out than it got on the way in. That’s a defensible, credible assumption for a professional-services roll-up rather than a cyclical asset, and it means the 17.3% IRR isn’t contingent on the exit market being friendlier than the entry market. But it also means there’s no tailwind doing any of the work. Every point of that IRR has to come from the business actually growing EBITDA 6.5% a year and the balance sheet actually delevering — which is a higher bar to clear reliably than “buy low, hope the market pays more later.”
17.3% is a real, respectable return — and it’s still below what most funds underwrite a new platform to. Buyout funds generally target 20–25% gross IRR on control platform investments; 17.3% net (18.8% gross) sits under that, even though 1.91x MOIC is a perfectly normal multiple of money on its own. New Mountain doesn’t need a bad thing to happen for this deal to underperform its own shop’s typical hurdle — it needs the base case, exactly as modeled, to play out. Getting to 20%+ requires something the base case doesn’t include: roughly a turn of multiple expansion, faster margin capture than the 120bps I modeled, bolt-on M&A, or — the more interesting possibility — the Benefits & Insurance carve-out generating proceeds or value this reconstruction simply doesn’t see. My read is that the real underwriting case inside New Mountain almost certainly leans on some blend of the last two, since a fund doesn’t sign for $5 billion on a platform it expects to merely clear a sub-hurdle return.
The financing structure is more conservative than it needs to be, and that has a real cost. The leverage-based sweep is realistic and credit-friendly — it’s exactly how real term loans amortize — but it produces a specific inefficiency: by FY2030E, the company is sitting on $715.3 million of cash earning roughly 3.5%, while the Term Loan it could have paid down instead costs 8.5%. That’s a negative carry of about 500 basis points on capital that, mechanically, the sweep formula chose not to deploy once leverage crossed below 3.5x. There’s a reasonable justification — liquidity buffer, dry powder for the bolt-on M&A the base case excludes, covenant headroom — but as modeled, it’s leaving return on the table relative to a more aggressive paydown path.
Where I could be wrong
1. This model levers a consolidated EBITDA base that the real transaction likely splits in two — and I can’t cleanly size the haircut. CBIZ’s FY2025 10-K breaks revenue into three practice groups: Financial Services ($2,301.5 million, 83.4% of revenue), Benefits & Insurance Services ($409.6 million, 14.9%), and National Practices ($46.9 million, 1.7%). The actual deal, per the merger 8-K, separates Benefits & Insurance into a distinct New Mountain-backed entity rather than folding it into the same capital structure as the core accounting and advisory business. This model doesn’t do that — it levers the full $446.9 million of consolidated FY2025A Adjusted EBITDA as if one company owns and grows all of CBIZ through FY2030E, and sizes a single $2,458.0 million term loan off that whole number.
I tried to size the haircut properly before deciding I couldn’t. The 10-K’s segment footnote (Note 19, Segment Disclosures) discloses pre-tax segment income — $334.6 million for Financial Services, $76.1 million for Benefits & Insurance, $6.0 million for National Practices, summing to $416.7 million before $182.4 million of unallocated corporate costs (G&A, stock-based compensation, Marcum integration charges, interest) that the 10-K explicitly does not attribute to any segment. That’s real, sourced data — but it isn’t Adjusted EBITDA. Depreciation and amortization isn’t broken out by segment; it’s commingled inside a line the 10-K calls “other costs, gains, and losses, net.” And the non-GAAP addbacks that bridge $234.0 million of consolidated GAAP operating income up to $446.9 million of Adjusted EBITDA — stock comp, consolidation and integration charges, the Marcum-related items specifically — sit almost entirely inside that unallocated corporate bucket, not inside either segment. There’s no clean way to build a “Benefits & Insurance Adjusted EBITDA” number from what’s disclosed, so I didn’t invent one.
The one directional clue that is available cuts against the comfortable assumption that this is a small problem: on the segment income figures that are disclosed, Benefits & Insurance actually runs a higher pre-tax margin (18.6%) than Financial Services (14.5%). Financial Services’ lower reported margin almost certainly reflects the Marcum acquisition’s intangible amortization, which sits overwhelmingly in that segment and depresses its GAAP income without depressing Benefits & Insurance’s the same way — which means a naive revenue-share haircut (14.9% of $446.9 million, leaving roughly $380 million behind) is a floor on what leaves with the carve-out, not a point estimate. What I can say plainly: the 5.5x entry leverage and ~2.2x FY2026E interest coverage in this model are both flattered relative to whatever capital structure actually gets levered against a Financial-Services-only entity. The bias runs one direction — less real EBITDA behind the debt than this model assumes — and it means the model’s returns are somewhat more fragile to rate and operating shocks than what’s shown above.
2. The go-shop is a real, dated window, not a formality. It runs through August 27, 2026. Topping bids on announced take-privates with committed financing are the exception rather than the rule, but “exception” isn’t “never,” and this model takes the $55.00 entry as fixed.
3. The margin-expansion thesis rests on an integration that’s still recent. The Marcum acquisition — the actual source of the 120bps of modeled margin expansion — closed less than two years before this deal was announced. The model assumes that integration finishes cleanly while an entirely new leveraged capital structure gets layered on top of it simultaneously.
4. The financing terms are calibrated, not disclosed. 5.5x leverage and SOFR+450 are my own estimates, benchmarked to comparable 2026-vintage deals — not the actual commitment letters. Whenever the merger proxy files, the real terms could move entry leverage, the all-in rate, or both, and either would move the IRR more than any operating assumption in this model.
Where this goes next
The go-shop window closes August 27th. The real test lands when the merger proxy — the PREM14A, then the DEFM14A — actually files: Goldman Sachs’s fairness opinion, the real financing commitment letters, and very likely CBIZ management’s own projections in place of the growth and margin assumptions I built here. Whether the Benefits & Insurance carve-out shows up as a distinct transaction, and at what value, is the single biggest open question this model can’t answer from public information alone. Once the proxy is out, I want to put my numbers next to the real ones and see how much of this survives contact.
Sources: CBIZ, Inc. Form 10-K for fiscal year 2025 (SEC EDGAR), including the practice-group results in Item 7 and the segment footnote (Note 19, Segment Disclosures) used in the Benefits & Insurance discussion above; CBIZ Q4 / full-year 2025 results release; the merger 8-K filed July 28, 2026; and the DEFA14A filed July 29, 2026. Filed documents can be located directly through the SEC’s EDGAR full-text search under CBIZ, Inc.
This is an educational analysis built from public filings and disclosures. It is not investment advice, and it is not affiliated with CBIZ, Grant Thornton Advisors, New Mountain Capital, or Goldman Sachs. Every financing, operating, and exit assumption beyond the announced $55.00 price, $5.0bn enterprise value, and disclosed premiums is my own and independent of any party to the transaction. All figures are subject to revision once the merger proxy (PREM14A/DEFM14A) and underlying financing commitment letters are filed.