Table of Contents
- Why buy-side analysts can’t just open the target’s GL
- What analysts actually get: the tear sheet
-
The finance, explained properly
- 1. The trial balance: the guardrail everything else stands on
- 2. Reported EBITDA vs. Adjusted EBITDA — the bridge that drives the price
- 3. Working capital, DSO, DPO, DIO, and the cash conversion cycle
- 4. Customer and vendor concentration — the HHI score
- 5. AR/AP aging — where a liquidity problem shows up first
- How the tokenization actually works — the part that makes this legal to use
- How it was built, and why this shape
- What this replaces
- Being honest about the limits
- How to actually use this — and see it for yourself
- Why I built this
The problem this project answers
Picture a buy-side M&A team a few weeks from signing. They have a target company’s confidentiality agreement in hand, a data room full of documents, and a due-diligence checklist that starts with the same question every deal starts with: is this company’s revenue, margin, and working capital actually what the seller says it is?
Answering that means an analyst needs to get into the general ledger — real revenue by month, real customer-by-customer concentration, real accounts-receivable aging. And that is exactly the moment where M&A deals run into a legal wall most outsiders never think about: before the deal closes, the buy-side team is often not allowed to see that data at all.
This project, ma-clean-room, is my answer to that wall — a self-hosted pipeline that lets analysts run real financial diligence on a target’s general ledger without a single person on the deal team ever seeing a raw name, account number, or IBAN. Everything below — every number, every screenshot — is real, unedited output from the tool itself, run against a synthetic target company. The repository is public: github.com/yirvisom/M-A-Clean-Room, and by the end of this post you’ll know exactly how to stand it up and run it against a deal of your own.
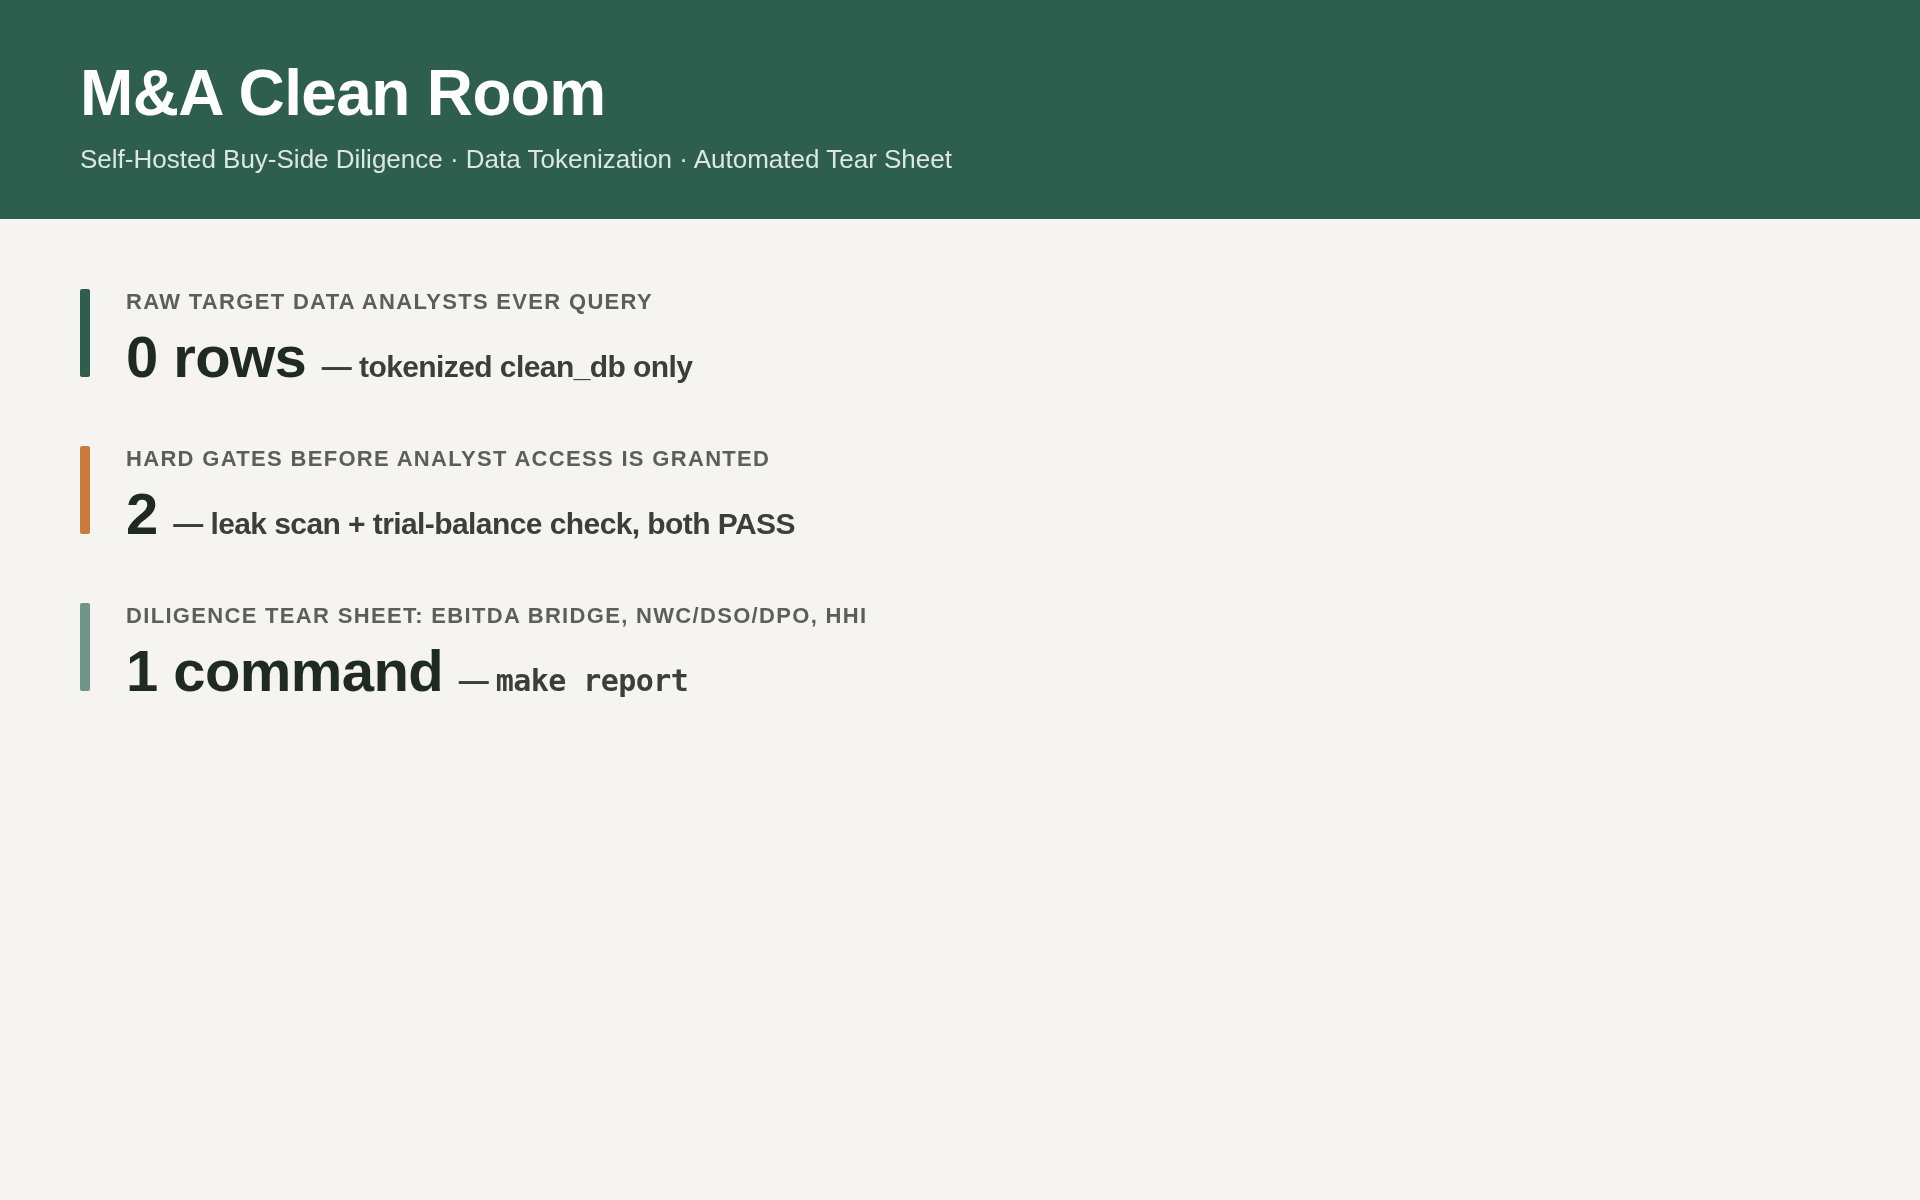
Not ready to dig into tokenization mechanics and Postgres schemas yet? This one-page overview covers what the project does and why, in about two minutes.
Why buy-side analysts can’t just open the target’s GL
This is the part that surprises most people outside deal work, so it’s worth explaining properly before anything else.
“Gun-jumping.” Under U.S. antitrust law (and equivalent regimes elsewhere), a buyer and a target that compete, or could compete, are not allowed to start coordinating or exchanging competitively sensitive information before the deal has cleared regulatory review and formally closed. Doing so — even informally, even with good intentions — is called “gun-jumping,” and it’s a real enforcement risk, not a theoretical one. A buy-side analyst poring over the target’s customer list, pricing, or margins pre-close can create exactly the appearance regulators are watching for.
Confidentiality agreements. Separately from antitrust law, the non-disclosure and confidentiality agreements that govern the deal itself typically restrict who on the buy side can see what, and when. A target sharing its unredacted general ledger with the acquirer’s full deal team, weeks before signing, breaches the deal’s own confidentiality terms — regardless of antitrust exposure.
The standard industry fix. For decades, the answer to this has been to hire an outside firm to stand up a data clean room: a neutral, access-controlled environment where the target’s raw data is uploaded, redacted or aggregated by a third party, and only then exposed to a restricted set of buy-side analysts under strict rules. These engagements are widely described across the industry as expensive and slow to stand up. There’s no single public benchmark — cost varies with deal size, scope, and vendor — but a meaningful share of what gets paid for is the same commodity work, re-solved from scratch on every deal: tokenizing sensitive fields, wiring up access control, and producing an audit trail that proves nothing leaked.
That’s the gap this project closes. ma-clean-room is that same clean-room function — tokenization, access control, audit trail — built once as software, reused on every deal for the marginal cost of a container instead of a consulting invoice.
What analysts actually get: the tear sheet
Before the mechanics, the output. This is cleanroom.report’s Preliminary Diligence Findings tear sheet — a one-page, print-ready summary a deal team can hand around on day one of diligence. It’s rendered as both HTML and PDF, built entirely from the tokenized clean_db’s curated views, by a read-only analyst role that has never had access to a single raw value. Every screenshot below is a real, unedited crop of that same generated report.

Five KPI tiles orient the reader immediately: the latest period’s revenue and adjusted EBITDA, net working capital and cash-conversion-cycle, and portfolio-wide customer and vendor concentration as an HHI score with a plain-language risk bucket next to it. No raw identifiers anywhere — a deal team could pass this exact page to outside counsel without a second thought.
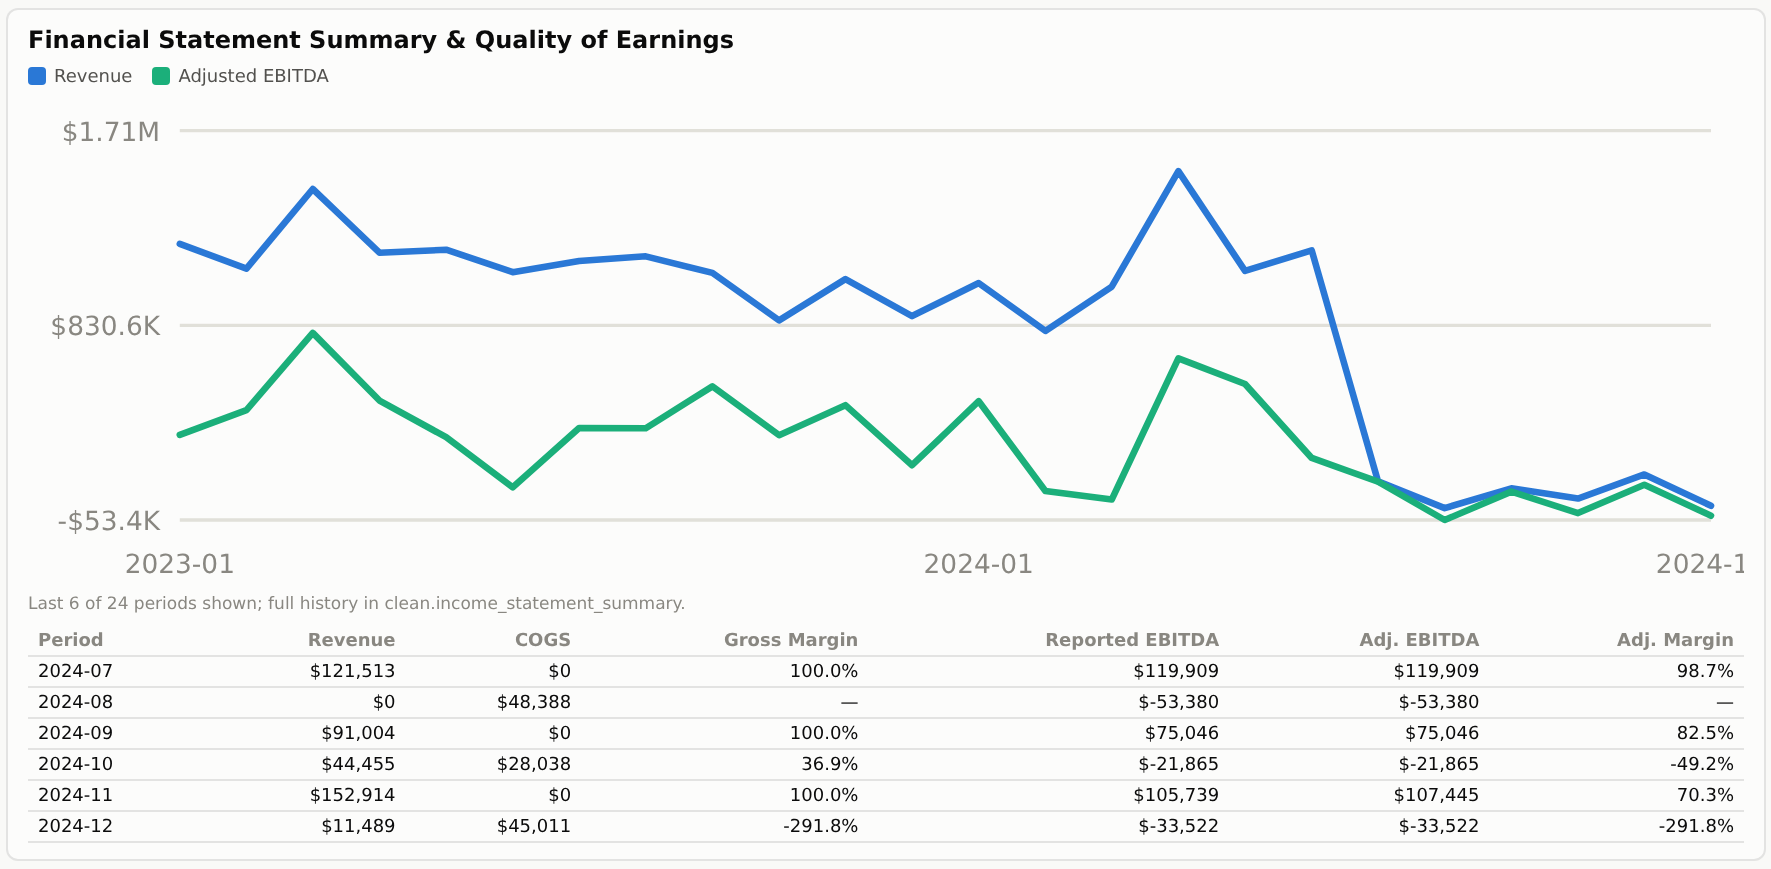

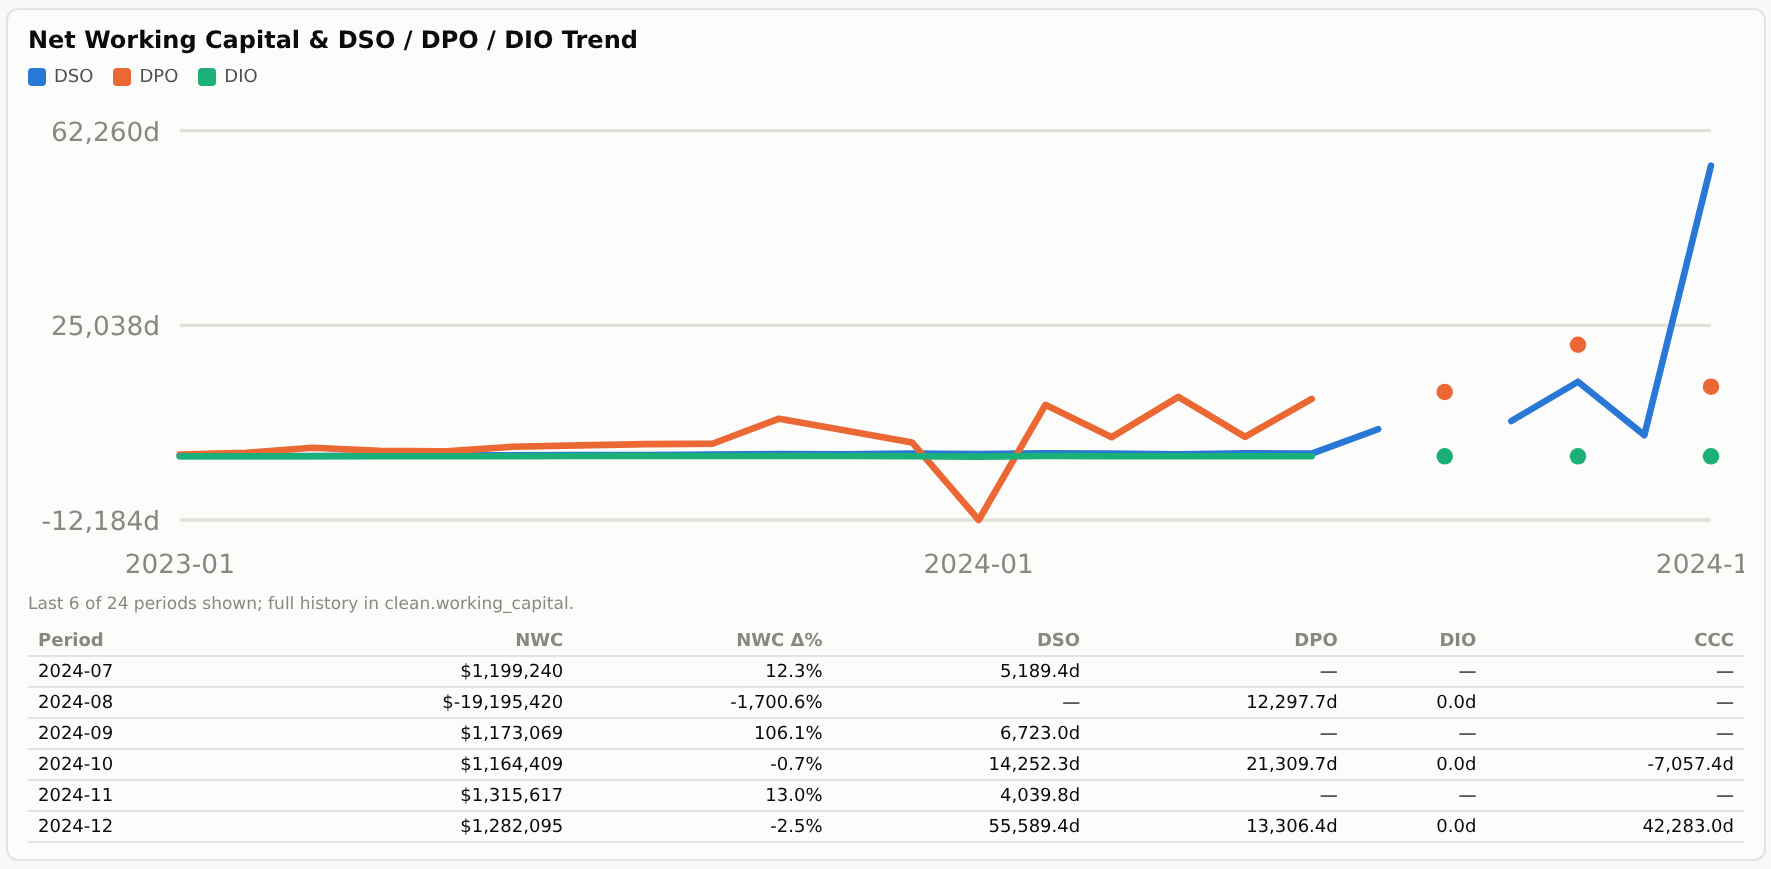

That single page is generated by one command, make report, reading nothing but clean_db’s curated views as the same low-privilege role a real analyst would use. Nothing about it is hand-assembled — it’s what the pipeline itself produces from a general ledger it has never let anyone see unredacted.
The finance, explained properly
The tear sheet packs in a lot of due-diligence vocabulary. Here’s what each piece actually means, why a buy-side team cares about it, and how the pipeline computes it — with the real numbers from the screenshots above as a live worked example.
1. The trial balance: the guardrail everything else stands on
Before any ratio or trend means anything, the ledger itself has to be internally consistent — every debit needs a matching credit. That’s what a trial balance checks: sum every debit-side entry, sum every credit-side entry, and confirm the two totals match. If they don’t, something in the ledger is broken — a dropped row, a bad currency conversion, a genuine bookkeeping error — and nothing built on top of it (income statement, EBITDA, working capital) can be trusted.
cleanroom.verify.check_trial_balance() runs this check on every load, independently for the whole ledger and period by period, and it’s a hard gate: if the whole-ledger totals don’t match within tolerance, the pipeline refuses to grant analyst access to anything, full stop. In the run behind this post, the ledger balanced — total debits equal total credits — with two single-period, single-cent discrepancies (visible in the “Flags for Manual Review” panel above) caused by independently rounding each side of a split multi-currency journal entry to the cent. That’s normal floating-point/rounding noise, not a bookkeeping error, and the pipeline is explicit about the distinction: those two cents are recorded and surfaced, but they don’t gate the pass/fail decision the way a real imbalance would.
2. Reported EBITDA vs. Adjusted EBITDA — the bridge that drives the price
EBITDA — Earnings Before Interest, Taxes, Depreciation, and Amortization — is the profitability measure most private-company M&A valuations are actually built on. Buyers typically pay a multiple of EBITDA (say, 5x, 8x, 12x depending on the industry and growth profile), so a $1 swing in EBITDA doesn’t move the price by $1 — it moves it by the multiple. Getting EBITDA right is one of the highest-leverage things diligence does.
But reported EBITDA — what’s literally in the ledger — is rarely the number a buyer should pay on. Sellers’ books often carry one-off items that depress or inflate earnings in a way that won’t recur post-close: a one-time legal settlement, an owner’s personal expenses run through the business, a non-recurring rebrand campaign. Adjusted EBITDA starts from reported EBITDA and adds those items back — an EBITDA bridge, walking from the reported number to the adjusted one, one add-back at a time.
This is exactly what clean.ebitda_bridge computes, driven by an editable config table (clean.ebitda_addback_config) that a deal team can tune per engagement — which expense accounts count as add-backs is a judgment call, and the tool treats it as one: a starting point for deal-team review, not an authoritative quality-of-earnings adjustment, as the tear sheet itself says directly underneath the bridge. On the fiscal-year rollup for this synthetic target, the bridge looks like this:
| Bridge line | FY2024 amount (USD) |
|---|---|
| Reported EBITDA | $1,144,022.12 |
| + Marketing Expense — one-time rebrand campaign | $270,345.16 |
| + Professional Fees — non-recurring transaction/legal costs | $855,449.84 |
| Adjusted EBITDA | $2,269,817.12 |
Reported margin: 16.26%. Adjusted margin: 32.27%. The add-backs roughly double the EBITDA a buyer might be pricing the company on — which is precisely why this bridge, not the raw income statement, is one of the first things a buy-side analyst asks for, and precisely why it needs to be reproducible and auditable rather than a black box in someone’s spreadsheet.
(A honest note on the tear sheet’s own “latest period” KPI tile above: it shows a single month, December 2024, with a negative adjusted EBITDA — because this specific synthetic dataset has a documented generator quirk that scatters a handful of stray entries into the tail end of its date range. It’s a known, disclosed artifact of the synthetic test data, not of the computation — and it’s a good demonstration of why a real diligence tool should show you the last-6-periods trend, not just a single headline tile, before you draw a conclusion.)
3. Working capital, DSO, DPO, DIO, and the cash conversion cycle
Net working capital (NWC) — current assets minus current liabilities, roughly: cash tied up in receivables and inventory, net of what’s owed to vendors — matters enormously in private M&A because most deals include a working-capital peg: the buyer and seller agree on a “normal” NWC level at signing, and the purchase price is adjusted dollar-for-dollar if the actual NWC at closing comes in above or below that peg. Getting the trend wrong in diligence means negotiating the peg on bad information — and losing real money at closing.
Three ratios make the trend legible instead of just a balance:
- DSO (Days Sales Outstanding) —
AR ÷ period revenue × days in period. How many days of sales are sitting uncollected in receivables. Rising DSO usually means collections are slipping. - DPO (Days Payable Outstanding) —
AP ÷ period COGS × days in period. How many days of purchases are sitting unpaid in payables. Rising DPO can mean better payment terms — or a company quietly stretching its vendors to manage cash. - DIO (Days Inventory Outstanding) —
inventory ÷ period COGS × days in period. How many days of inventory are sitting on the shelf.
Put together: Cash Conversion Cycle (CCC) = DSO + DIO − DPO — the number of days between paying cash out for inputs and collecting cash in from customers. A shorter (or negative) CCC means the business is efficient at turning operations into cash; a lengthening CCC is an early, quantifiable warning sign that’s easy to miss just eyeballing a balance sheet.
On the early, undistorted part of this run’s data (before a known synthetic-data effect described below), the shape is exactly what this ratio set is built to catch:
| Period | AR (USD) | AP (USD) | DSO (days) | DPO (days) | DIO (days) | Cash conversion cycle (days) |
|---|---|---|---|---|---|---|
| 2023-01 | $1,312,026.95 | $901,684.68 | 33.9 | 309.9 | 16.4 | -259.6 |
| 2023-02 | $2,420,048.23 | $1,928,834.46 | 62.3 | 690.6 | 19.5 | -608.8 |
| 2023-03 | $3,849,273.38 | $2,800,943.20 | 82.3 | 1,642.3 | 0.0 | -1,560.0 |
| 2023-04 | $5,007,487.75 | $3,791,238.84 | 129.5 | 1,072.1 | 17.2 | -925.4 |
4. Customer and vendor concentration — the HHI score
A target that looks profitable can still be a bad acquisition if 80% of its revenue comes from two customers who could walk the day after closing. Diligence needs a way to quantify that risk, not just eyeball a top-10 list — which is exactly what the Herfindahl-Hirschman Index (HHI) does. It’s the same index U.S. antitrust regulators use to score market concentration, repurposed here to score revenue concentration:
HHI = the sum of each customer’s revenue share, expressed as a percentage, squared. A company with 100 equal customers (1% each) scores 100 × 1² = 100. A company with two customers at 50% each scores 2 × 50² = 5,000. The pipeline buckets the result the same way DOJ/FTC guidance does: under 1,500 is “Low,” 1,500–2,500 is “Moderate,” over 2,500 is “High.”
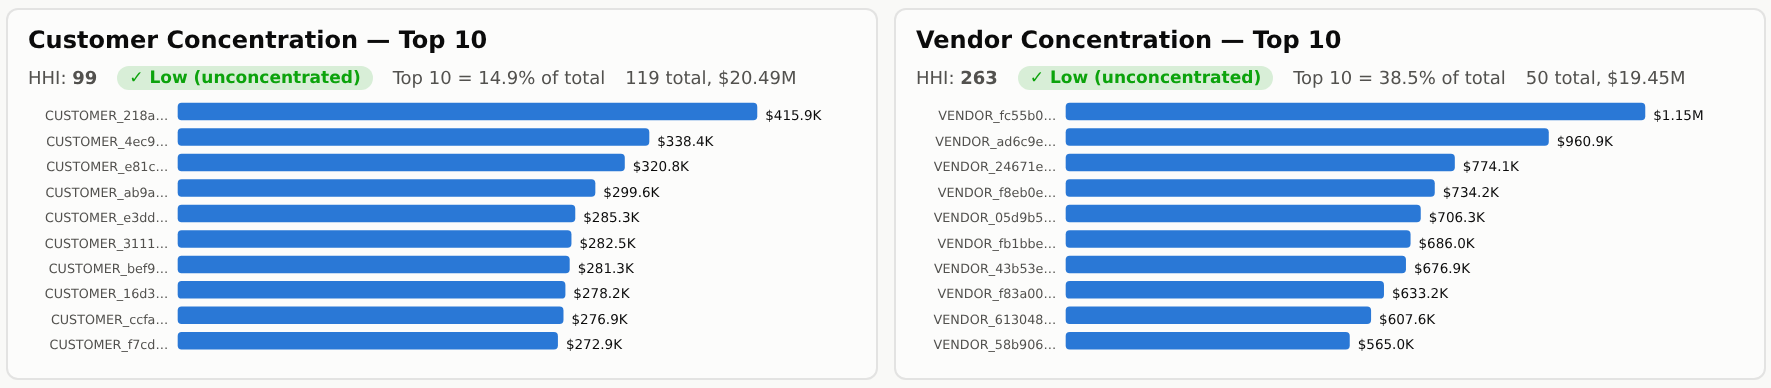
In this run: customer HHI of 99 (Low — 119 customers, top 10 just 14.9% of $20.49M total revenue) and vendor HHI of 263 (Low — 50 vendors, top 10 at 38.5% of $19.45M total spend). Both computed on the entire customer/vendor base, not just the top 10 shown on the chart — a portfolio that looks concentrated in the visible top 10 but isn’t overall (or vice versa) is exactly the kind of thing a single bar chart can hide and the underlying HHI can’t.
5. AR/AP aging — where a liquidity problem shows up first
The last panel buckets every open receivable and payable into 0–30, 31–60, 61–90, and 90+ day buckets. In this run, AR shows 816 transactions totaling $20,489,928 — almost entirely sitting in the 90+ bucket — the single clearest, earliest signal of a collections problem diligence can surface, well before it shows up in a cash balance.
How the tokenization actually works — the part that makes this legal to use
Everything above is computed from data an analyst is legally allowed to see. Here’s the mechanism that makes that true, in the order data actually moves through it.
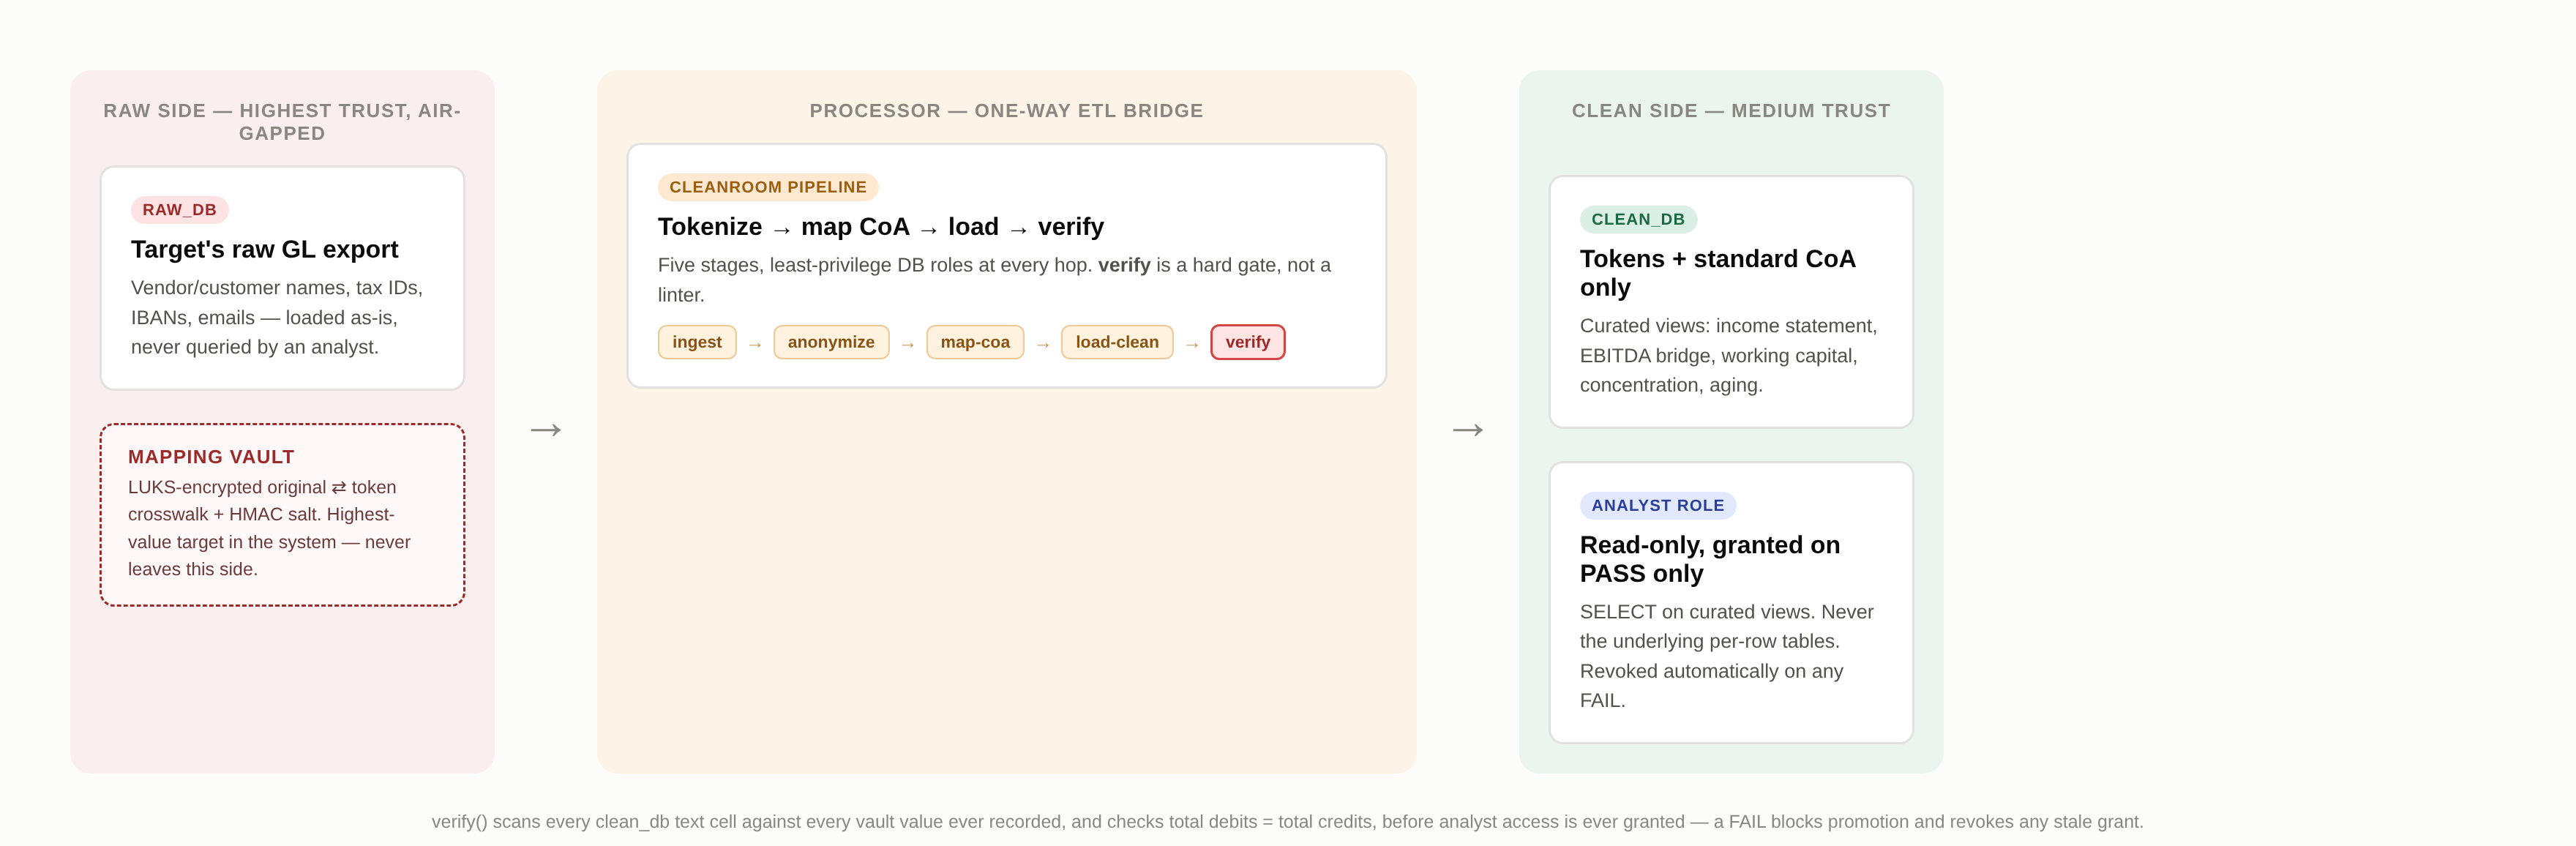
1. Tokenize, deterministically. As data lands in the isolated raw_db, cleanroom.anonymize replaces every vendor name, customer name, tax ID, IBAN, and email with HMAC-SHA256(salt, normalized_value) before anything crosses into clean_db. HMAC is a keyed hash — same input and same secret salt always produce the same token, but there’s no way to run the function backward without the salt. That determinism matters operationally: two ledger rows for the same real vendor — "ACME CORPORATION" and "Acme Corp." — reconcile to the same token, so an analyst can still group and trend by counterparty over time, they just never see who the counterparty actually is.
| Field | Raw value | What the analyst sees | Mechanism |
|---|---|---|---|
vendor_name |
"ACME CORPORATION" / "Acme Corp." |
VENDOR_3f9a2c1b8e4d7a10c2b5 (same token for both) |
HMAC token of the suffix-stripped core name |
tax_id |
"12-3456789" |
TAXID_9e1d4a7c0b3f6e82d5a1 |
HMAC token of the normalized tax ID |
iban |
"DE89 3704 0044 0532 0130 00" |
IBAN_7b2e5f8a1c4d9b60e3f7 |
HMAC token of the whitespace-stripped IBAN |
account_code (target’s own CoA) |
"AC-6010" |
standard_account_id = "6010" (Rent Expense) |
Deterministic crosswalk — not tokenized, since a chart-of-accounts code isn’t sensitive on its own |
phone, city, description |
present in raw ledger | absent entirely | Dropped by the clean-side column allowlist, not tokenized |
2. Vault the mapping, and only the mapping. The original-to-token crosswalk — the one thing that could ever de-anonymize this data — is written to a single place: a LUKS-encrypted mapping vault, mounted only transiently during a pipeline run, never touched by anything on the clean side. It’s explicitly called out in the project’s threat model as the single highest-value target in the whole system, on the logic that anyone who steals that file collapses the entire clean-room boundary in one step — everything else in the design exists to keep that file isolated.
3. Gate on two independent checks, and grant nothing until both pass. cleanroom.verify runs two hard checks before anyone gets access: the trial-balance check described above, and a leak scanner that reads every text cell of every clean-side table and checks it against every raw value the vault has ever recorded — not just this run’s, all of them. Either check failing blocks the entire grant; there’s no partial access. Every run — pass or fail — writes an append-only audit record: a PASS/FAIL status, the violation list (empty on a clean pass), and a SHA-256 hash of every clean table’s contents, so a second run against the same inputs can be diff-checked byte-for-byte against the first.
4. Grant least privilege, only after a PASS. Only after that gate clears does the analyst role get SELECT on the curated views — the ones behind every screenshot above — and never on the raw per-row tables underneath them. A FAIL doesn’t just withhold a new grant; verify.py actively revokes any existing one, so a stale grant from an earlier passing run can never quietly outlive a later failure. That’s backed up at the infrastructure layer too: containers run read-only root filesystems with capabilities dropped, and the raw and clean database networks have no route between them at all — so even a full compromise of the clean side has nothing to pivot to.
How it was built, and why this shape
The stack is deliberately boring where it needs to be reliable and precise where it needs to be defensible: Python for the ETL and analytics layer, PostgreSQL for both raw_db and clean_db (two entirely separate clusters, not schemas in one database — the air gap needed to be structural, not just a permissions setting), Docker Compose for the container topology and hardening, Ansible for provisioning the isolated hosts, WeasyPrint to render the tear sheet’s HTML into a print-ready PDF, and pytest with a full CI suite that runs the entire ingest → anonymize → map-coa → load-clean → verify pipeline against synthetic data on every push — so the leak-scanner gate and the trial-balance gate are exercised for real on every commit, not just described in a README.
The design choices that mattered most weren’t the obvious ones. Two are worth calling out because they came directly from taking the finance side as seriously as the engineering side:
- The trial-balance tolerance had to be relative, not a fixed cent amount. An early, stricter version used a flat one-cent tolerance on the whole-ledger check — and it turned out a handful of legitimate runs failed the gate purely from independently rounding each side of a split multi-currency journal entry to the cent, not from any real imbalance. The fix scales the tolerance with entry count (
sqrt(entry count), reflecting that these rounding errors partially cancel rather than accumulate linearly) rather than loosening it arbitrarily — tight enough to still catch a dropped row or a real FX bug, loose enough not to cry wolf on rounding noise a real audit would never chase. - The EBITDA add-back list had to be config, not code. Which expenses count as one-time add-backs is a judgment call that changes deal to deal — baking it into application logic would mean a code change and a redeploy every time a deal team disagreed with a prior assumption. It lives instead in an editable, queryable config table, with the tool explicit that it’s a starting point for review, never an authoritative adjustment on its own.
What this replaces
| Outside clean-room engagement | ma-clean-room |
|
|---|---|---|
| Cost | Widely reported as expensive, deal-by-deal | One-time setup; marginal cost per deal is just infrastructure |
| Timeline | Weeks — staffing, tooling, review cycles with a vendor | Minutes to bring up the stack and run the pipeline once secrets exist |
| Reuse across deals | Re-scoped and re-negotiated with the vendor each time | Same pipeline and controls every deal; a fresh encrypted vault per engagement |
| Auditability | Depends on the vendor’s own tooling | Built in: an append-only audit record + table-hash manifest on every run |
The tokenization, access control, and audit trail are the expensive, hard-to-differentiate part of a bespoke clean-room engagement. This project is that work, done once, reviewed like any other code change, and reused instead of re-bought.
Being honest about the limits
A diligence tool that hides its own edge cases isn’t one I’d trust, so the project documents its known limitations in detail rather than smoothing them over — and it’s worth repeating the headline ones here, since a couple of the numbers above are affected by them:
- The synthetic test data behind every screenshot in this post has a generator quirk, not a computation bug: journals are only dated within an ~18-month window, but a documented, fixed rule for resolving ambiguous day/month date formats occasionally reparses a handful of entries into calendar months the generator barely touched — which is exactly why the tear sheet’s last few periods show a sharp, erratic revenue swing, and why the DSO/DPO/DIO trend drifts to implausible levels late in the window (the AP/AR journals also never book a later cash-settlement entry, so those balances only ever grow). On a real target’s ledger — where collections and payments actually get booked — this same computation is exactly what would catch a genuine deterioration; here, the mechanism is real and the specific late-period trend is a synthetic-data artifact, clearly labeled as such in the repository’s own documentation.
- The leak scanner does exact/case-insensitive substring matching against known vault values — a defense-in-depth layer behind the column allowlist and tokenization step, not a semantic scrubber. It will not catch a raw value that’s been paraphrased or split across cells; the allowlist and tokenization upstream are what actually prevent that class of leak.
- This has not had an independent third-party security review. The project’s
THREAT_MODEL.mdsays so explicitly, and I’d say the same to anyone before pointing it at a real deal’s data.
How to actually use this — and see it for yourself
You don’t need to take any of the above on faith. Everything in this post is reproducible from the public repository in a few commands.
If you just want to see the output — no setup required — the full, real, unedited pipeline output (every CSV behind the numbers above, the audit record, and the HTML/PDF tear sheet) is committed in the repo at docs/sample_output/, with a full column-by-column reference at docs/data_dictionary.md.
If you want to run the pipeline yourself against a fresh synthetic target (this is genuinely the fastest way to feel what a diligence analyst’s experience looks like — clone it, run it, and open the tear sheet it produces):
git clone https://github.com/yirvisom/M-A-Clean-Room.git
cd M-A-Clean-Room
pip install -e .

# CI-equivalent mode: skips LUKS encryption, fine for a local test run —
# never use plain mode against a real target's data.
python -m cleanroom.gen_data --out-dir sample_data
CLEANROOM_STORAGE_MODE=plain make storage-up secrets up
docker compose exec -T clean_db psql -U postgres -d clean_db < sql/standard_coa.sql
make pipeline

# Render your own tear sheet — HTML and PDF, into docs/sample_output/
make report
make pipeline runs the full ingest → anonymize → map-coa → load-clean → verify chain and prints a PASS/FAIL. If it fails — on purpose, try deleting a row from the synthetic CoA mapping first — you’ll see exactly what a real deal team would see: promotion to clean_db blocked, and the reason why, in plain text.
If you’re standing this up for a real engagement, drop the CLEANROOM_STORAGE_MODE=plain override entirely — the default luks mode formats and opens a genuine LUKS2-encrypted vault and prompts for a passphrase the first time. Read THREAT_MODEL.md’s non-goals first, and disable swap (or make sure it’s encrypted) before you do, since a plaintext swap device can leak the vault passphrase and the HMAC salt out of memory regardless of how well the vault itself is configured — it’s covered in the README’s “Storage vault” section in full.
If you’re an analyst who just wants to query the output — no pipeline run needed on your end — point any SQL client, Excel, or Power BI connection at clean_db as the read-only analyst role and query the curated views directly:
-- Revenue, COGS, gross margin, and reported/adjusted EBITDA by month
SELECT * FROM clean.income_statement_summary ORDER BY fiscal_year, fiscal_month;

-- AR/AP/inventory balances, DSO/DPO/DIO, and cash conversion cycle by month
SELECT * FROM clean.working_capital ORDER BY fiscal_year, fiscal_month;

-- Top 10 customers by revenue, with Pareto cumulative % and portfolio HHI
SELECT * FROM clean.customer_concentration WHERE is_top10 ORDER BY revenue_rank;
That’s the whole point of the design: the report above isn’t a privileged export an analyst has to request and wait for — it’s exactly what any analyst can reproduce themselves with a SELECT, the moment verify says PASS.
Why I built this
I work in financial modeling and valuation, not security engineering — which is precisely why this project mattered to me. The best diligence tools I’d want to hand a deal team don’t just compute the right ratios; they make it structurally impossible to accidentally break the rule that decides whether a deal team can even see the data in the first place. That’s a constraint most financial models never have to think about, and building a pipeline that treats “an analyst should never see a raw name” as an enforced invariant — not a policy someone has to remember — was the most useful thing I could learn by actually shipping it, end to end, rather than reading about it.
If you work in M&A, private equity diligence, or corporate development and any of this — the EBITDA bridge, the working-capital trend, the concentration scoring, or the access-control model itself — is something you’d want to poke at, adapt, or challenge, the repository is open and documented in full: github.com/yirvisom/M-A-Clean-Room. Issues, questions, and pull requests are genuinely welcome.
Stack: Python · PostgreSQL · Docker Compose · Ansible · WeasyPrint · pytest/CI.