Table of Contents
Ideologies → Wars → Politics → Economy → Finance → M&A
The biggest merger of the last century: Exxon × Mobil.
Follow the chain backward and it holds together better than it has any right to. Arab nationalism and Zionism, and — after 1979 — the Shia revolutionary ideology of Ayatollah Khomeini’s Iran, produced the wars: the Yom Kippur War of October 1973 (“la guerre du Kippour,” named for the Jewish holy day it began on), the Iranian Revolution and the Iran-Iraq War that followed it, and the string of Middle East conflicts that kept the region unsettled for a generation. The wars produced the politics: OPEC’s 1973 embargo, and Saudi Arabia’s 1985 decision to fight for market share instead of defending price. The politics produced the economics: a quarter-century of oil-price whiplash. The economics produced the finance: a cost-cutting, balance-sheet-driven industry where it was cheaper to buy a barrel of oil on Wall Street than to go find one in the ground. And the finance produced the M&A: nine mega-mergers in three years, Exxon-Mobil the cleanest specimen of them all.
From John D. Rockefeller’s Standard Oil to the 3 greats: Exxon, Mobil and Chevron. Dan Brown would have probably called them the “3 sénéchaux” — those who kind of inherited, in the 1911 breakup, the secret of abundance and massive production of oil in the USA. 3 sénéchaux who didn’t die as in Dan’s “The Da Vinci Code,” but rather survived a 25-year crisis, from the Yom Kippur War and the first oil shock of 1973 to the eve of the millennium’s turn, when crude fell within a whisker of $10 a barrel.
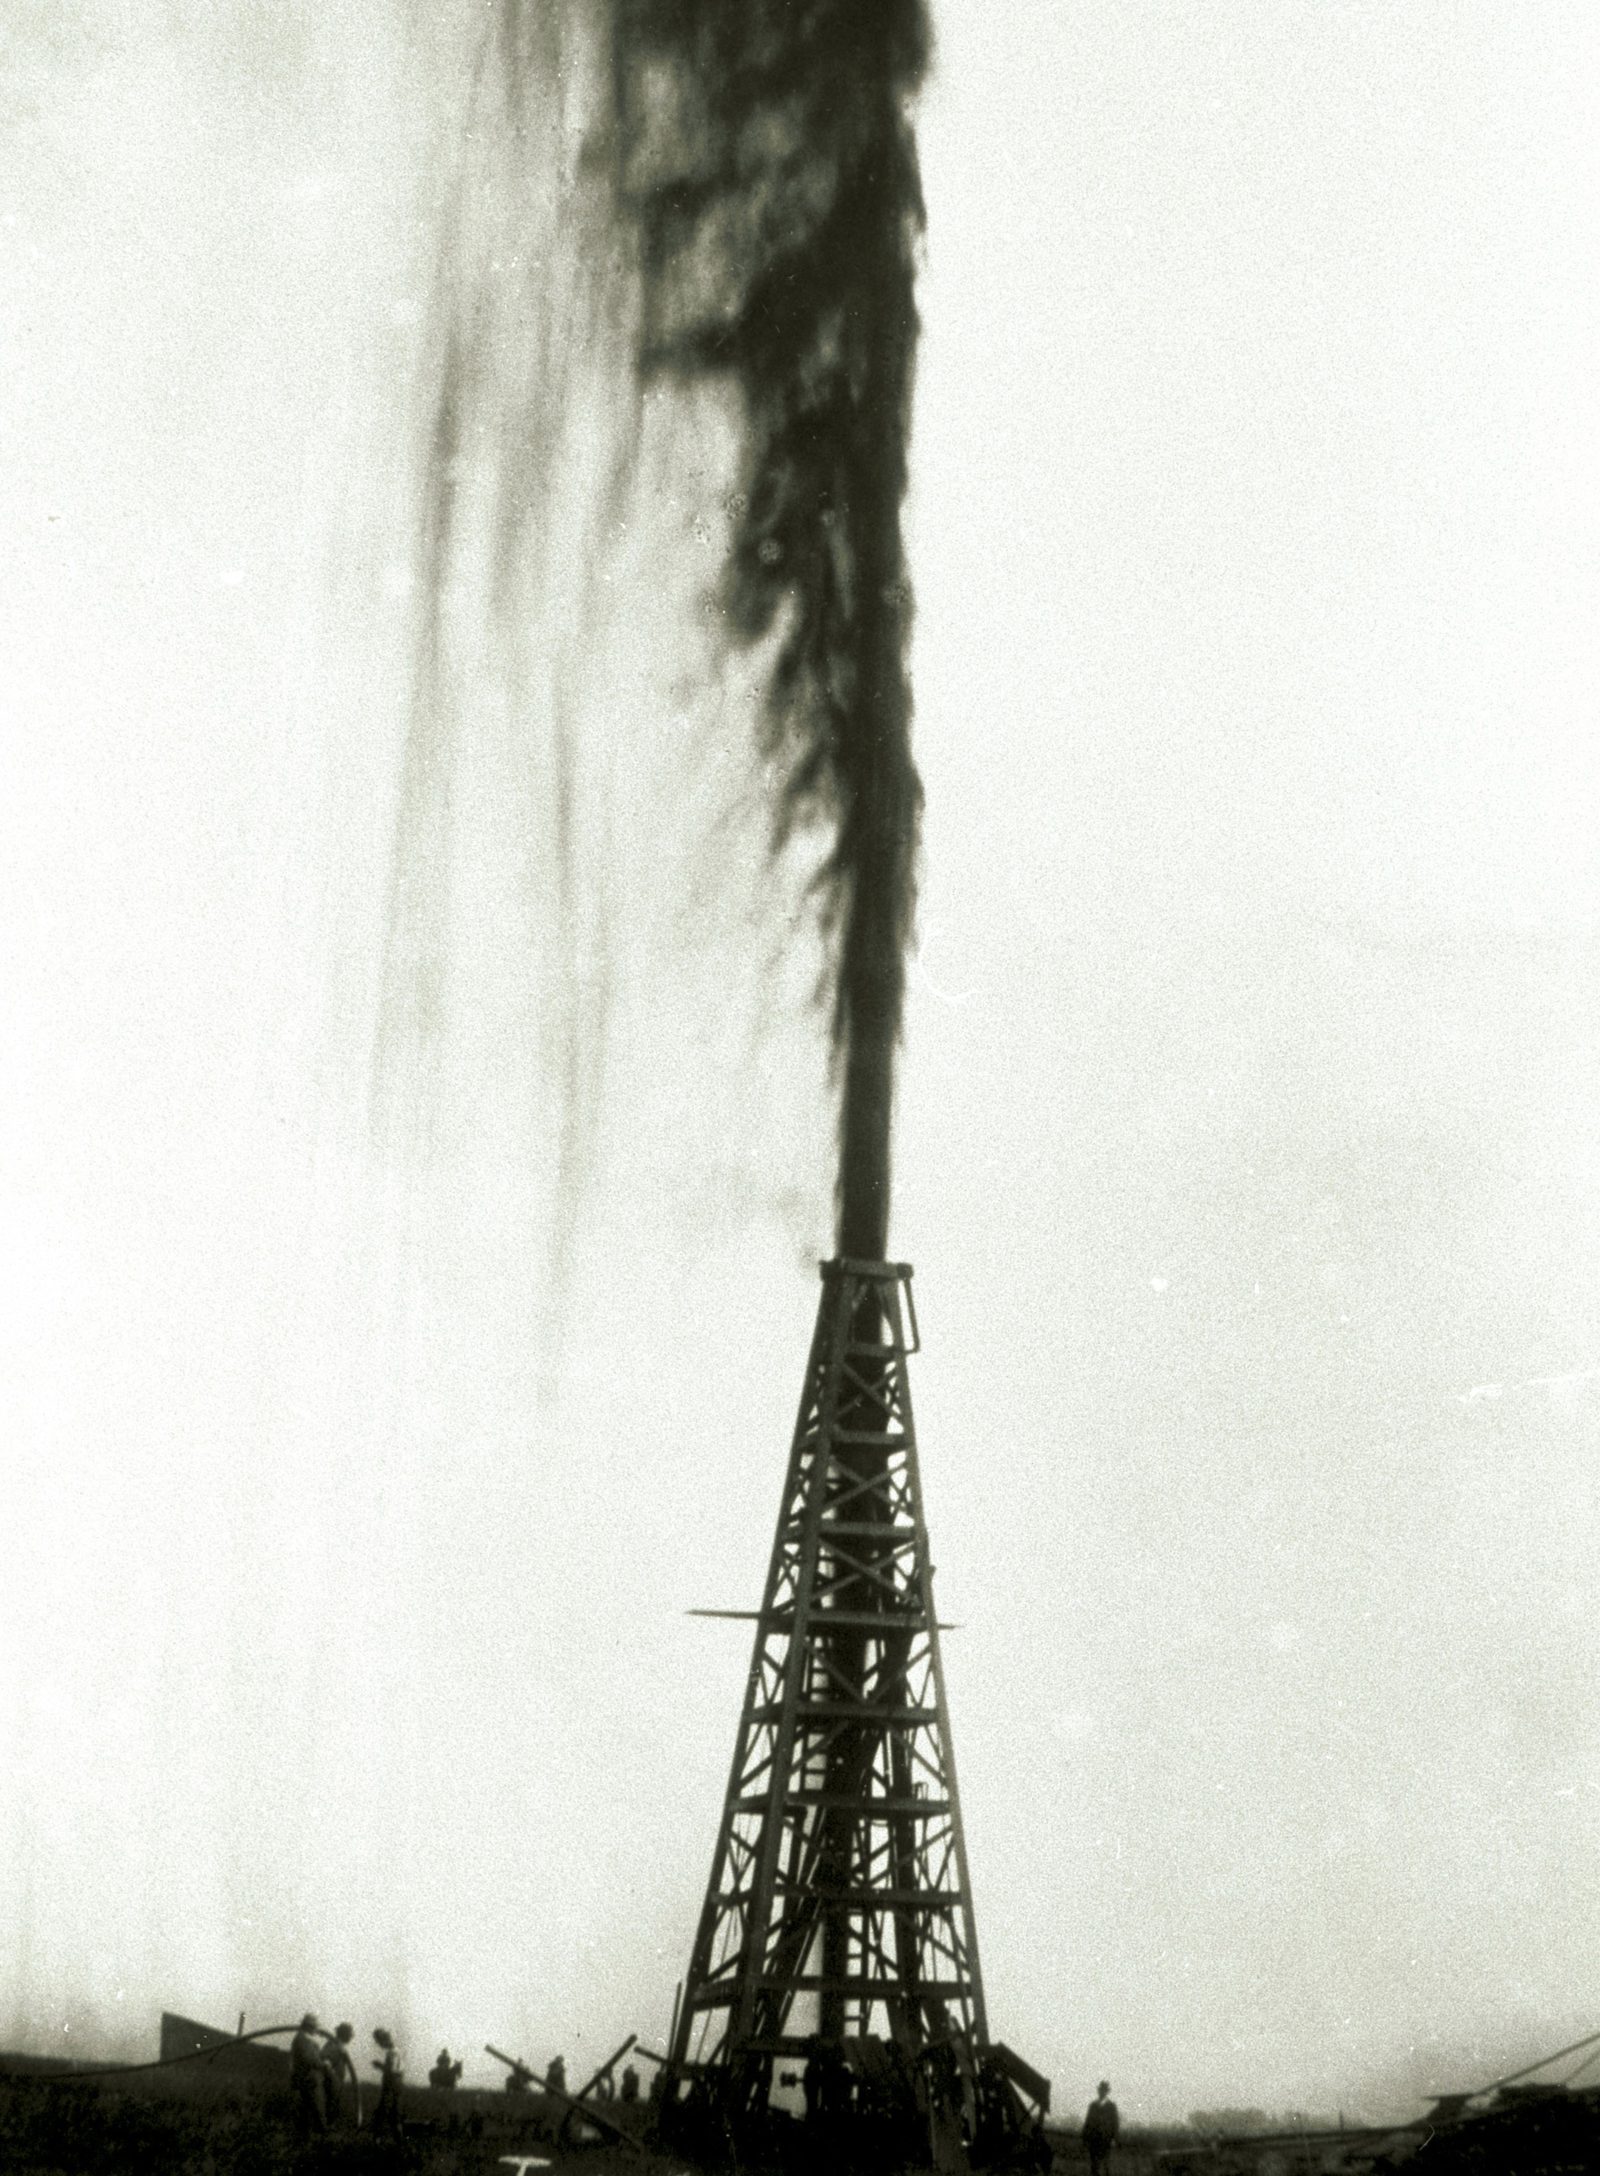
(Above: the Lucas Gusher, the well that founded the American oil age at Spindletop, Texas, on January 10, 1901 — nine days of uncontrolled flow at a rate no one had ever measured before. Everything that follows, the empire, the breakup, the century of mergers, starts here.)
An empire cut into thirty-four pieces
By 1911, Rockefeller’s Standard Oil didn’t compete in the American oil market — it was the American oil market, controlling something on the order of nine barrels in every ten refined in the country. The U.S. Supreme Court ended that with an antitrust order that split the trust into thirty-four separate companies. Most of them dissolved into irrelevance or got absorbed by rivals within a generation. Three did not: Standard Oil of New Jersey, which became Esso and then Exxon; Standard Oil of New York, which became Socony-Vacuum and then Mobil; and Standard Oil of California, which became Chevron. The sénéchaux kept their fiefdoms.
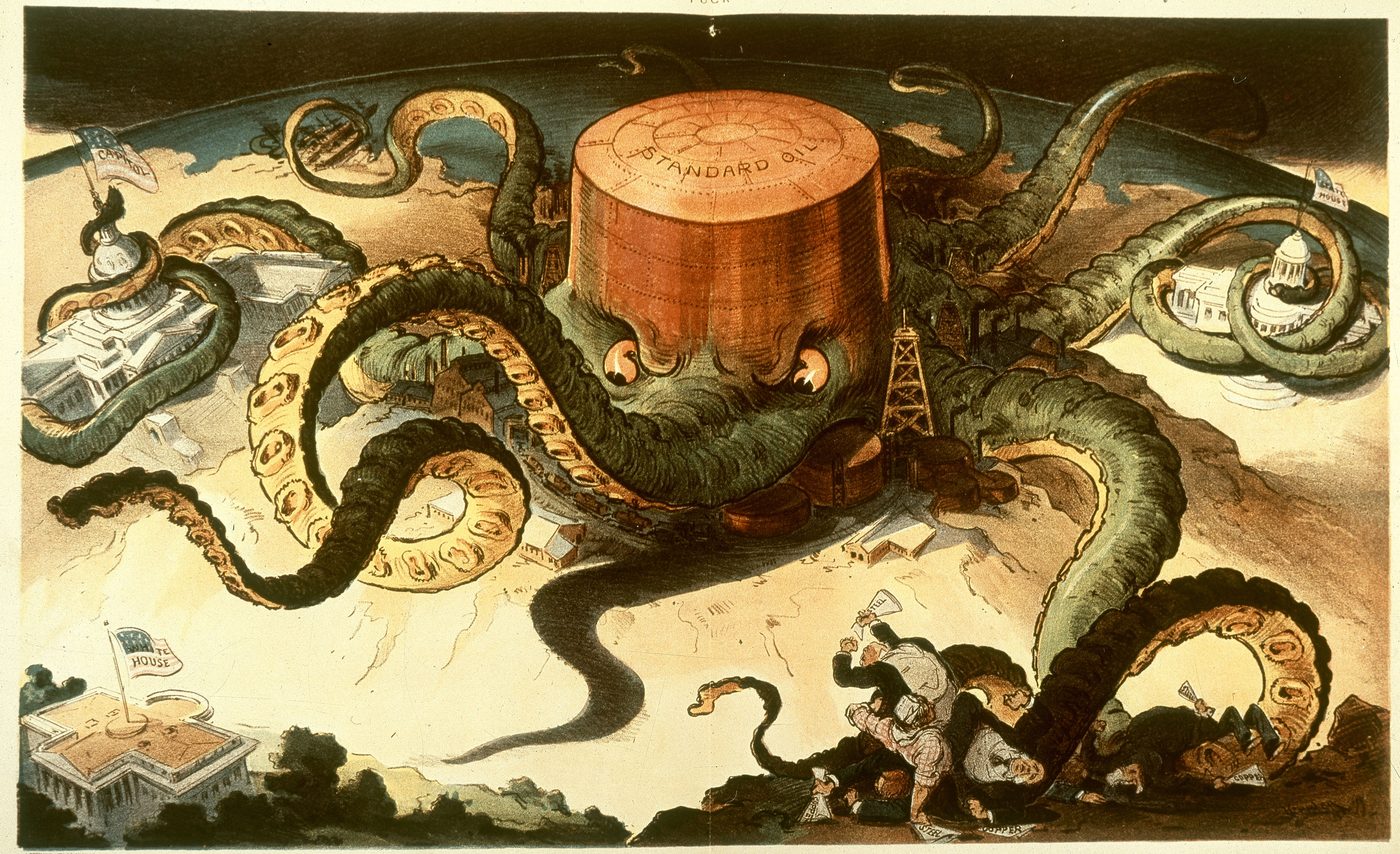
What the breakup didn’t do was end the underlying logic that had built Standard Oil in the first place: scale lowers your cost per barrel, and in a commodity business, cost per barrel is close to the whole game. That logic went dormant for six decades of comfortable, regulated growth. Then 1973 woke it back up, violently, and kept it awake for twenty-five years.
1973: the world tilts
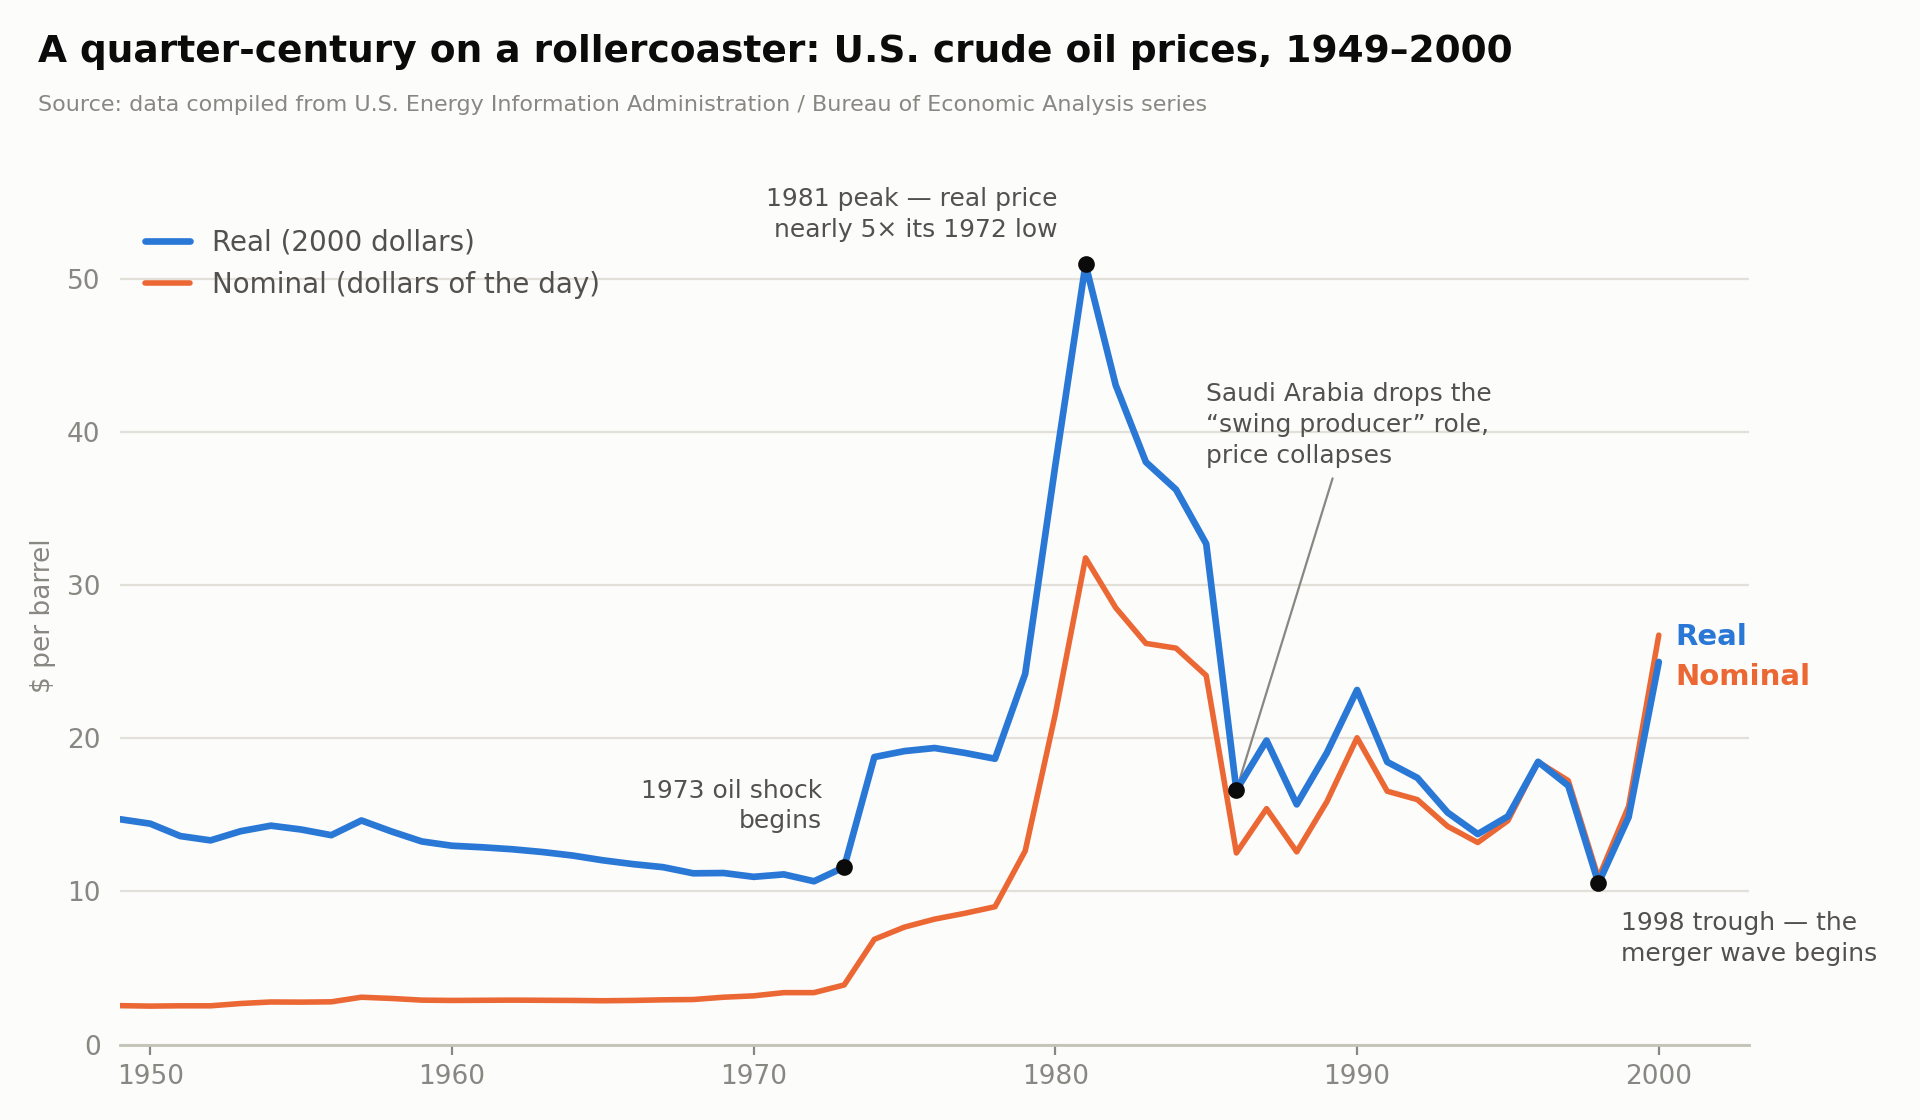
The Arab oil embargo of October 1973 didn’t just raise prices — it demonstrated, for the first time to a generation raised on cheap energy, that the ground under the entire industrial economy could move without warning. In barely a year, the real price of crude very nearly tripled. It kept climbing through the decade — a second shock in 1979, the Iranian revolution — until it peaked in 1981 at close to five times its level a decade earlier.
The response, on both sides, was entirely rational. OPEC, which controlled roughly 55% of the world’s oil at the start of the decade, discovered it could set the price. Consumers and industry discovered they could unlearn dependence: smaller cars, better insulation, factories re-engineered to burn something other than oil. Exploration that had been uneconomic for years suddenly wasn’t. Wells that had been capped came back online. By 1985, OPEC’s share of a market it once dominated had fallen below 30% — proof that a cartel’s pricing power, however real in the short run, has a ceiling the moment it makes alternatives to its product profitable.
Saudi Arabia had spent those years playing the role no other member wanted: absorbing everyone else’s quota-cheating by cutting its own output, acting as the buffer that kept the cartel’s price target intact. In December 1985, it stopped. It chose to fight for market share instead of defending price. The result was less a decline than a collapse: crude fell from the low $30s to roughly $10 a barrel within months — a two-thirds drop in a matter of weeks, the kind of move that doesn’t get absorbed gently by an industry built on decade-long capital projects.
The 1980s: learning to bleed less
What followed the 1986 crash was less a recovery than a long, grinding adjustment. The majors had built their cost structures for a world of $30-plus oil; they now had to survive on a third of that. Between 1980 and 1992, the eight biggest oil companies cut their combined workforce from roughly 800,000 to 300,000 — a reduction of well over half. Corporate headquarters, once bloated with layers of staff, were gutted just as hard: six major companies cut their combined HQ headcount from 3,000 to 800 people in the four years from 1988 to 1992 alone. Companies stopped owning tankers and started leasing them — trading fixed cost for variable cost, a hedge against the next price swing nobody could predict but everybody now assumed was coming.
It was also, not coincidentally, the decade of the corporate raider. With oil company shares trading at a fraction of the value of the reserves sitting on their balance sheets, it was cheaper to acquire a barrel of oil on Wall Street than to go find one in the ground. More than $60 billion of horizontal mergers rolled through the industry in the first half of the 1980s — Chevron’s takeover of Gulf Oil alone was worth over $13 billion, at the time the largest corporate acquisition in history. The message embedded in every one of those deals was the same: efficiency was no longer a nice-to-have. It was survival.
1998: the floor gives way again
By the mid-1990s, a decade and a half of cost-cutting and technology had pulled the industry’s breakeven cost down to somewhere around $16 to $18 a barrel — real progress, but still fragile. Then the 1997-98 Asian financial crisis hit global demand at exactly the moment non-OPEC supply was ample, and crude fell below $10 a barrel by late 1998. At that price, even the leanest of the majors were no longer comfortably earning their cost of capital on new investment. The math simply didn’t close.
The response was the same one the industry had reached for in the 1980s, only bigger. BP moved first, announcing its acquisition of Amoco on August 11, 1998, with roughly $2 billion in projected synergies — a number that put every other CEO in the sector on notice. Exxon and Mobil followed a few months later. Over the following three years, nine major mergers reshaped the top of the industry: BP-Amoco, Exxon-Mobil, Total’s acquisition of PetroFina followed by TotalFina’s hostile pursuit of Elf Aquitaine (forming TotalFinaElf), BP Amoco’s acquisition of Arco, Chevron’s takeover of Texaco, Phillips’s acquisition of Tosco, and finally the Phillips-Conoco “merger of equals” that created ConocoPhillips. Different boardrooms, different countries, the same target number: push the breakeven cost down toward $11 to $12 a barrel, low enough that even a bad year for oil still cleared the cost of capital.
Exxon-Mobil is simply the cleanest specimen of that species — the deal every finance textbook would pick if it had to pick one.
The deal: not “just paper”
Exxon announced its acquisition of Mobil on December 1, 1998; the deal closed on November 30, 1999. It was, at signing, the largest corporate merger ever recorded, and structurally almost the reverse of what people picture when they hear “merger”: there was no cash. Exxon paid entirely in its own stock, at an exchange ratio of 1.32 Exxon shares for every Mobil share outstanding.
| Exxon | Mobil | |
|---|---|---|
| Pre-merger market value | $175.0 billion | $58.7 billion |
| Share price (pre-announcement) | $72.00 | $75.25 |
| Shares outstanding | 2,431 million | 780 million |
| Post-merger ownership | ~70.2% | ~29.8% |
Total consideration came to roughly $74.2 billion — a premium of $15.5 billion, or 26.4%, over Mobil’s undisturbed market value (and, tellingly, close to 290% over Mobil’s book value, a reminder of how much of an oil major’s true worth was never on its balance sheet to begin with).
Here is the point worth sitting with: people love to say that in a stock-for-stock deal “the terms don’t matter, you’re just swapping paper.” That is precisely backwards. The exchange ratio is the single number that decided how the combined company’s ownership got carved up — Mobil shareholders ended up with roughly three of every ten shares of the new ExxonMobil not because of some vague notion of fairness, but because 1.32 is the ratio Exxon’s board agreed to pay. Move that ratio by a tenth, and tens of billions of dollars of value shift silently from one set of shareholders to the other. Paper, in a deal this size, is never “just” anything.
The market’s initial verdict was clear and slightly lopsided: over the eleven trading days bracketing the announcement, Mobil’s industry-adjusted cumulative return was +14.8%; Exxon’s was -0.5%. Ten trading days after the announcement, Mobil was up 20.6%, Exxon up 3.1%. Both positive — the market believed the economic logic of the deal — but the seller, as usual, got to keep more of the applause.

What the spreadsheet actually says
Strip away the ticker symbols and a merger like this is a bet on a discounted cash flow model: forecast the free cash the combined company will throw off for the next decade or so, add a “terminal value” for everything beyond that, and discount the whole stream back to today at a rate that reflects how risky those cash flows are. That discount rate — the cost of capital — blends the return equity investors demand with the after-tax cost of the company’s debt, weighted by how much of each the firm actually uses.
Two things about oil majors’ cost of capital are worth knowing, because they explain a lot of what happened next. First, both Exxon and Mobil carried a stock market “beta” below 1 — their share prices historically moved less than the overall market, not more, largely because global demand for oil is stickier than demand for most other things people buy. That kept their cost of equity relatively modest, in the 11% range, for companies running enormous, long-lived capital projects. Second, small changes in the assumptions — the revenue growth rate, the operating margin, how long the “competitive advantage” period lasts before growth fades to something ordinary — swing the estimated value of a company this size by tens of billions of dollars. That sensitivity is exactly why boards fight so hard over numbers that look, from the outside, like rounding errors: a percentage point on the margin assumption is worth more than most companies’ entire market cap.
None of this is unique to Exxon-Mobil. It’s the same arithmetic every big-ticket acquisition runs on. What made this one instructive is how quickly the promised numbers turned into real ones.
Synergies: the rare promise that outran the pitch
At announcement, Exxon and Mobil projected roughly $2.8 billion a year in “synergies” — mostly (about two-thirds) from shutting duplicate facilities and stripping out excess capacity, the rest from combined purchasing power and sharing whichever company had the better process for a given task. Skeptics treat synergy numbers as the most reliably inflated line in any merger deck.
This one wasn’t. By August 2000 — about seven months after the deal closed — chairman Lee Raymond announced that realized synergies had already reached $4.6 billion, well ahead of the original schedule. Analysts, watching the integration unfold, were by late 2001 projecting the number would reach $7 billion by 2002 — two and a half times the original pitch. Whatever else you want to say about ExxonMobil, hubris in the boardroom doesn’t usually come paired with under-promising and over-delivering on cost cuts.
Why the antitrust regulators shrugged
Combining the world’s two largest oil companies sounds, on its face, like exactly the kind of deal antitrust regulators exist to stop. It wasn’t, and the reason is almost entirely a question of scale versus scale.
Regulators lean on a concentration measure called the Herfindahl-Hirschman Index — square each competitor’s market share and add them up. A score under 1,000 draws essentially no scrutiny; above 1,800, a deal is likely to be challenged outright. The global petroleum industry had sat at an HHI of roughly 400 since the mid-1970s, an almost absurdly unconcentrated number for an industry full of household names. Run the arithmetic on all nine of the era’s mega-mergers together — not just Exxon-Mobil, all of them — and the industry-wide HHI rises from 389 to 583. An increase, certainly. But 583 is still nowhere near the 1,000-point line where regulators even start asking hard questions, let alone the 1,800-point line where a deal gets blocked.
The plain explanation is that the pond these fish swam in was almost incomprehensibly large. Even a company as vast as ExxonMobil was one competitor among thousands in a global industry measured in the trillions, competing against national oil companies, independents, and state producers who don’t show up neatly in a market-share table. Regulators did require some targeted fixes at the edges — ExxonMobil sold off overlapping wholesale distribution assets, BP Amoco divested Arco’s Alaskan crude holdings and its Cushing, Oklahoma operations — but nobody seriously argued the combination itself created monopoly power. There was, quite simply, too much ocean for one more big fish to change the tide.
The archetype
Which is really the whole point. Exxon-Mobil wasn’t an outlier, a bet driven by ego or empire-building dressed up in a fairness opinion. It was the textbook case — the reason a finance professor would reach for this deal specifically, out of the nine, when explaining to a room of students what a merger is for. Two of Rockefeller’s own sénéchaux, forced back together not by nostalgia for the old trust but by twenty-five years of a brutal, unpredictable price environment that had made “smaller and independent” a luxury the industry could no longer afford.
The 1911 breakup had scattered the empire because it was too powerful for the market to bear. The 1998 remarriage put a piece of it back together because the market — twenty-five years of oil shocks, cartel overreach, and a price crash that came within a whisker of single digits — had made scale, once again, the only rational answer to survival. History doesn’t repeat, they say. But sometimes it does rhyme loudly enough that you can build a discounted cash flow model on the echo.